News

News
FTFL - November Is for Numbers
This article appeared in our November 2025 issue of From the Front Lines, Bowen’s roundup of news and trends that educate, inspire and entertain us. Click here to subscribe.
Fair warning to our readers: we know you love data and this month’s FTFL is an M&A deep dive! While 2025 has not yet played out, we think the Q3 YTD market stats below are strongly correlated to how the year will play out over the next 49 days.
Is M&A back? We’ve been seeing plenty of headlines indicating that deal activity is rising. This month we dig into the data and apply our own filters. Throughout the following charts, we compare Q1-Q3 2025 vs. the same period in 2024.
First we look at the big picture, global M&A.
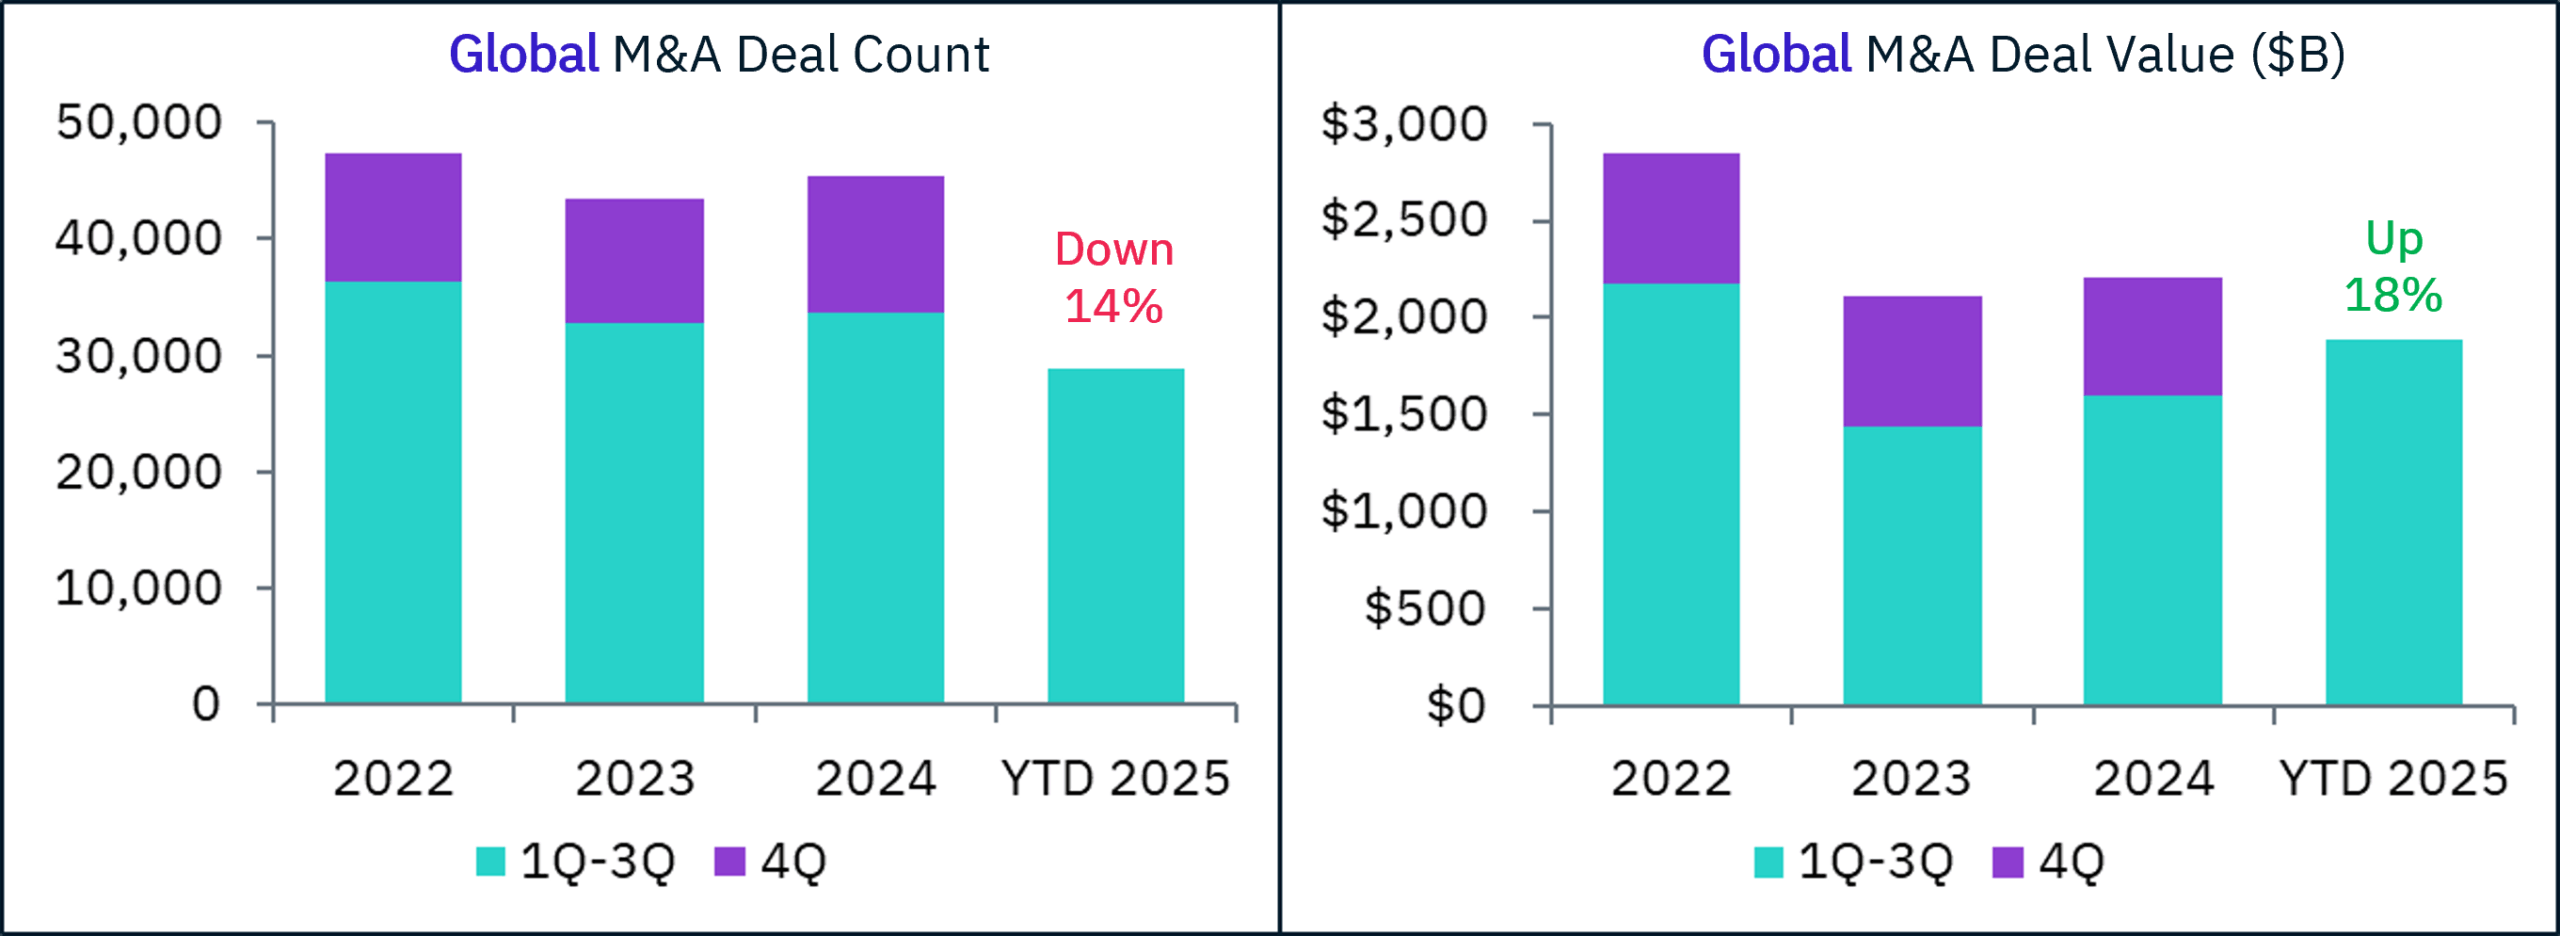
Deal count is down and deal value is up, but neither dramatically, and both relatively in-line with the prior 3 years.
With apologies to our friends across the globe, for the remainder of our analysis we’re going to focus on US data only. The current government induced data fog notwithstanding, it provides us with a cleaner dataset from Pitchbook and other sources. Note to international readers – if you wish to see any other geography-specific data, please ping us.
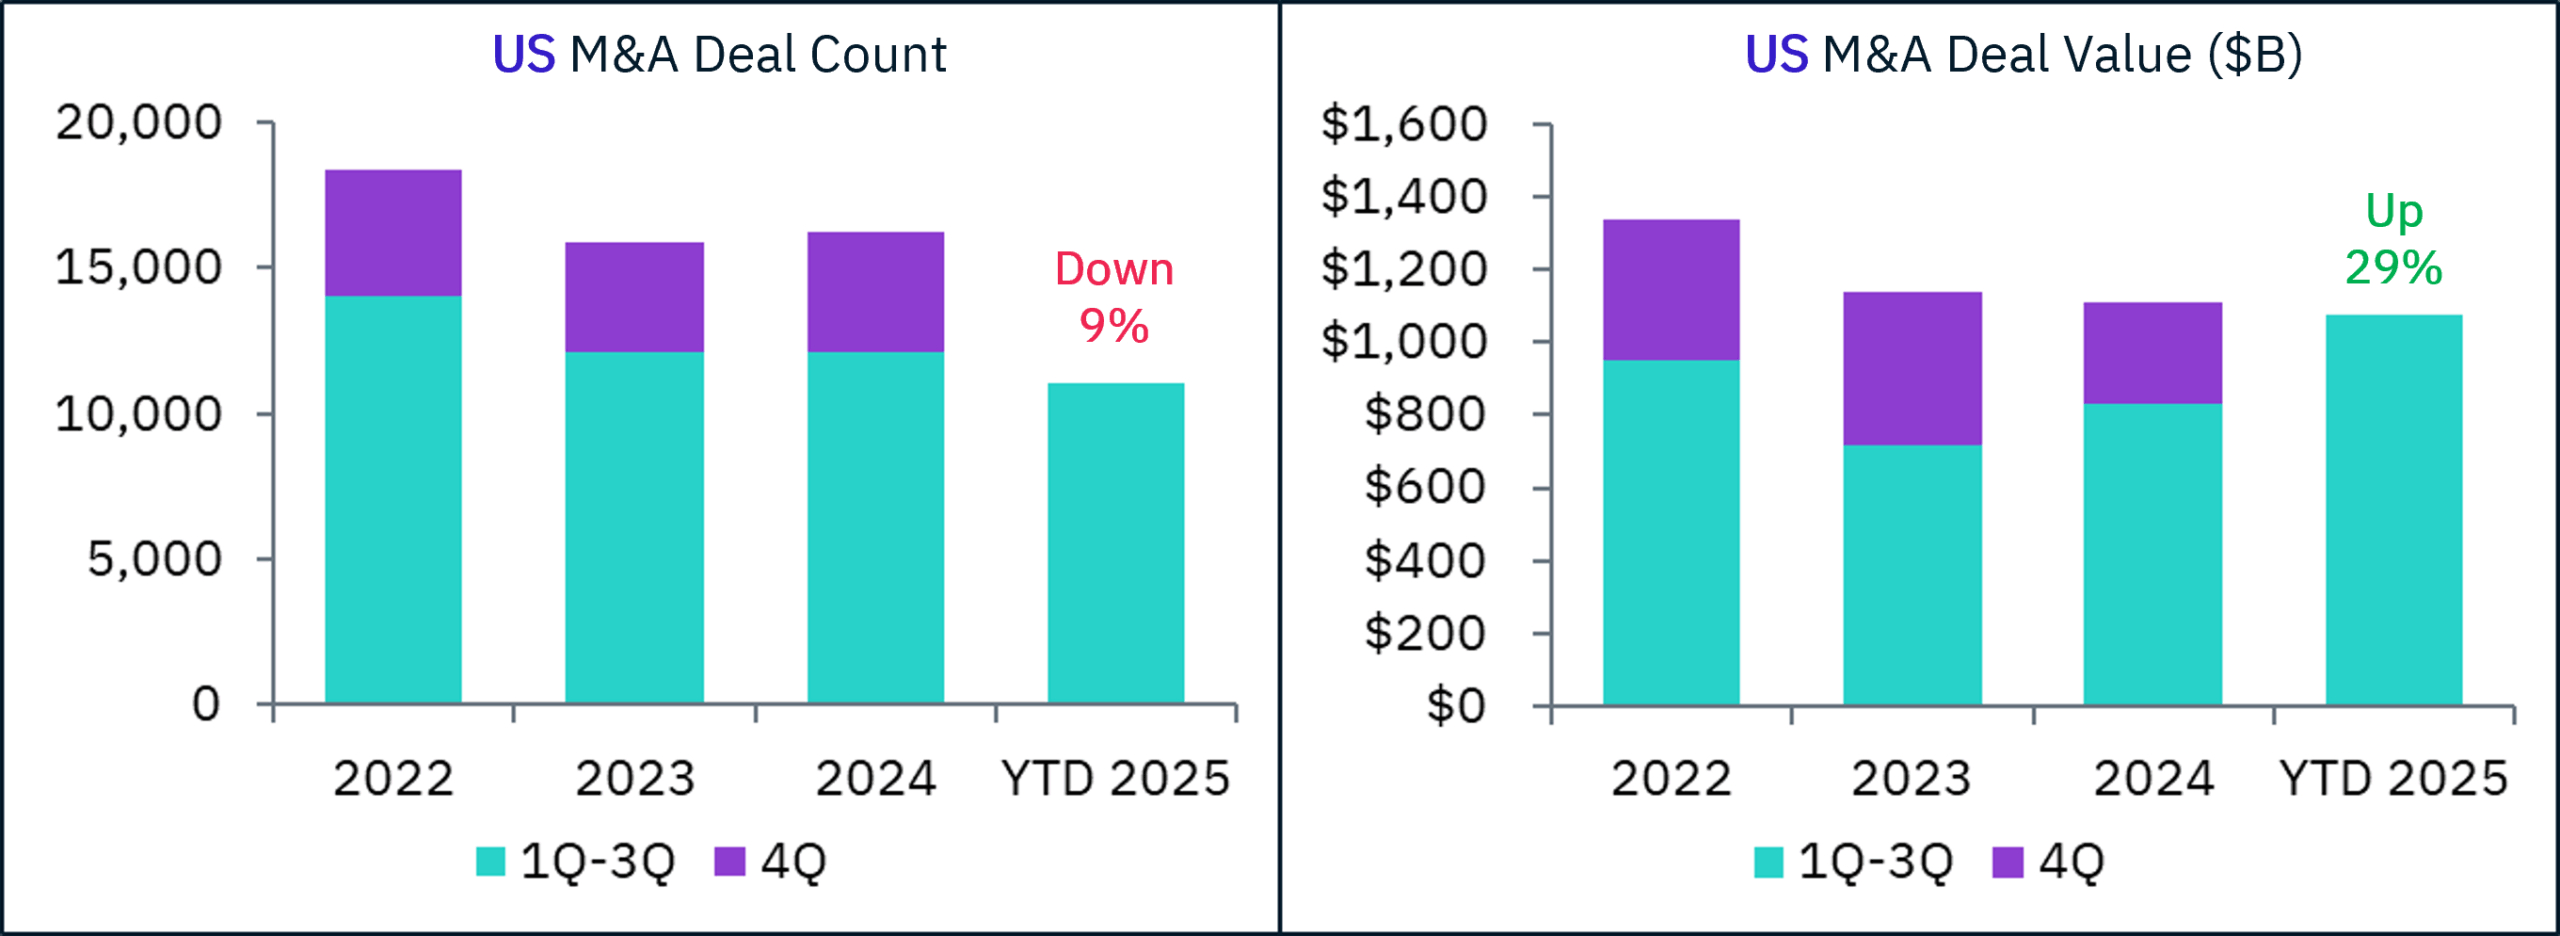
US deal value has made a solid comeback, and 2025 looks on pace to be the highest since 2021. Lately, when we’ve seen a strong growth stat like this, there’s been a familiar culprit…
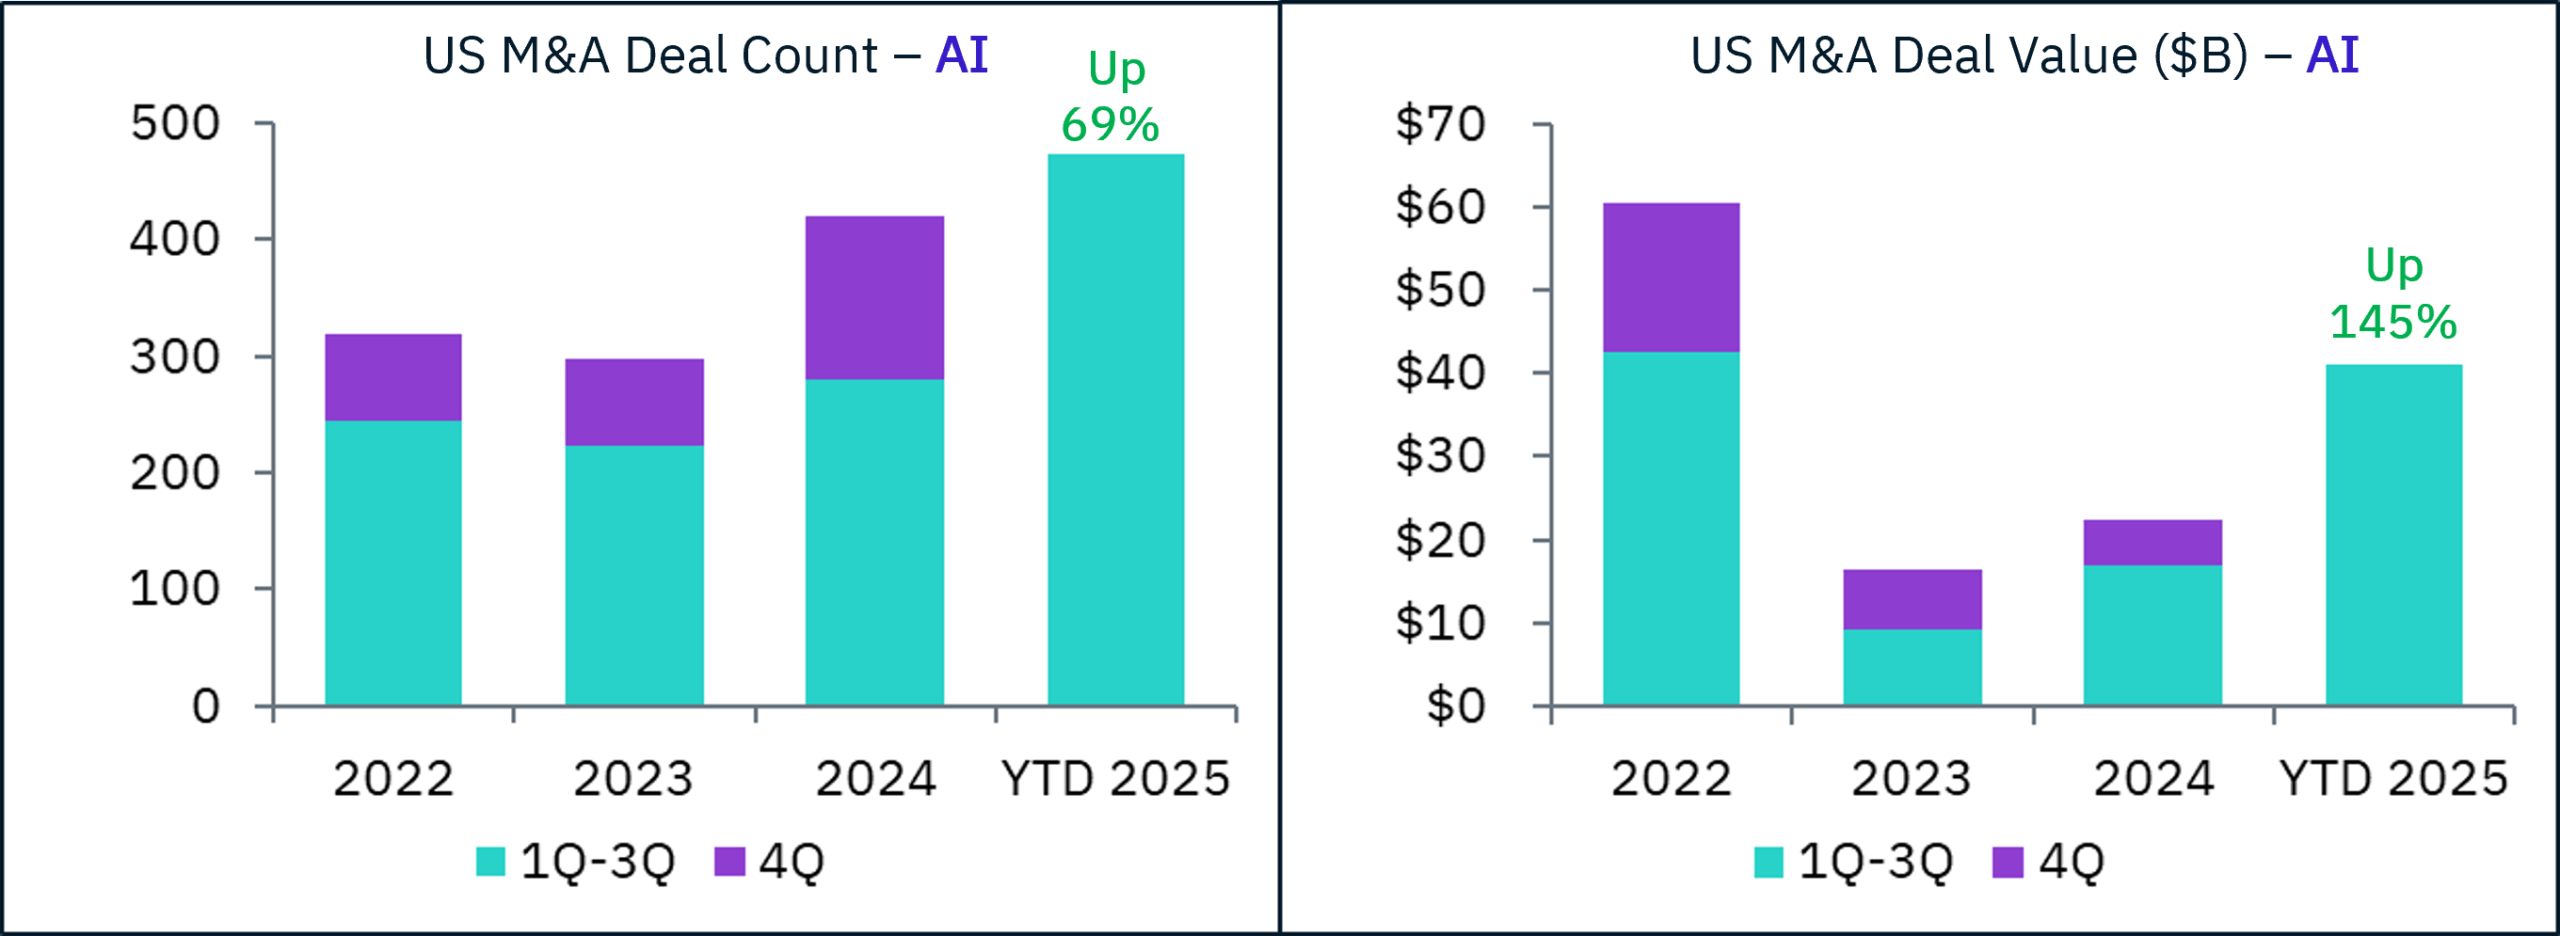
AI is up quite a bit, but if we look at the numbers, YTD AI deal value of $40B is only 4% of the US total – impressive growth but still a small piece of the pie, as we showed in September.
Let’s slice and dice the US data by deal size – <$50M, $50M-$300M, $300M-$1B and $1B+. Just based on deal counts down and deal value up, it looks like it would tilt toward larger deals.
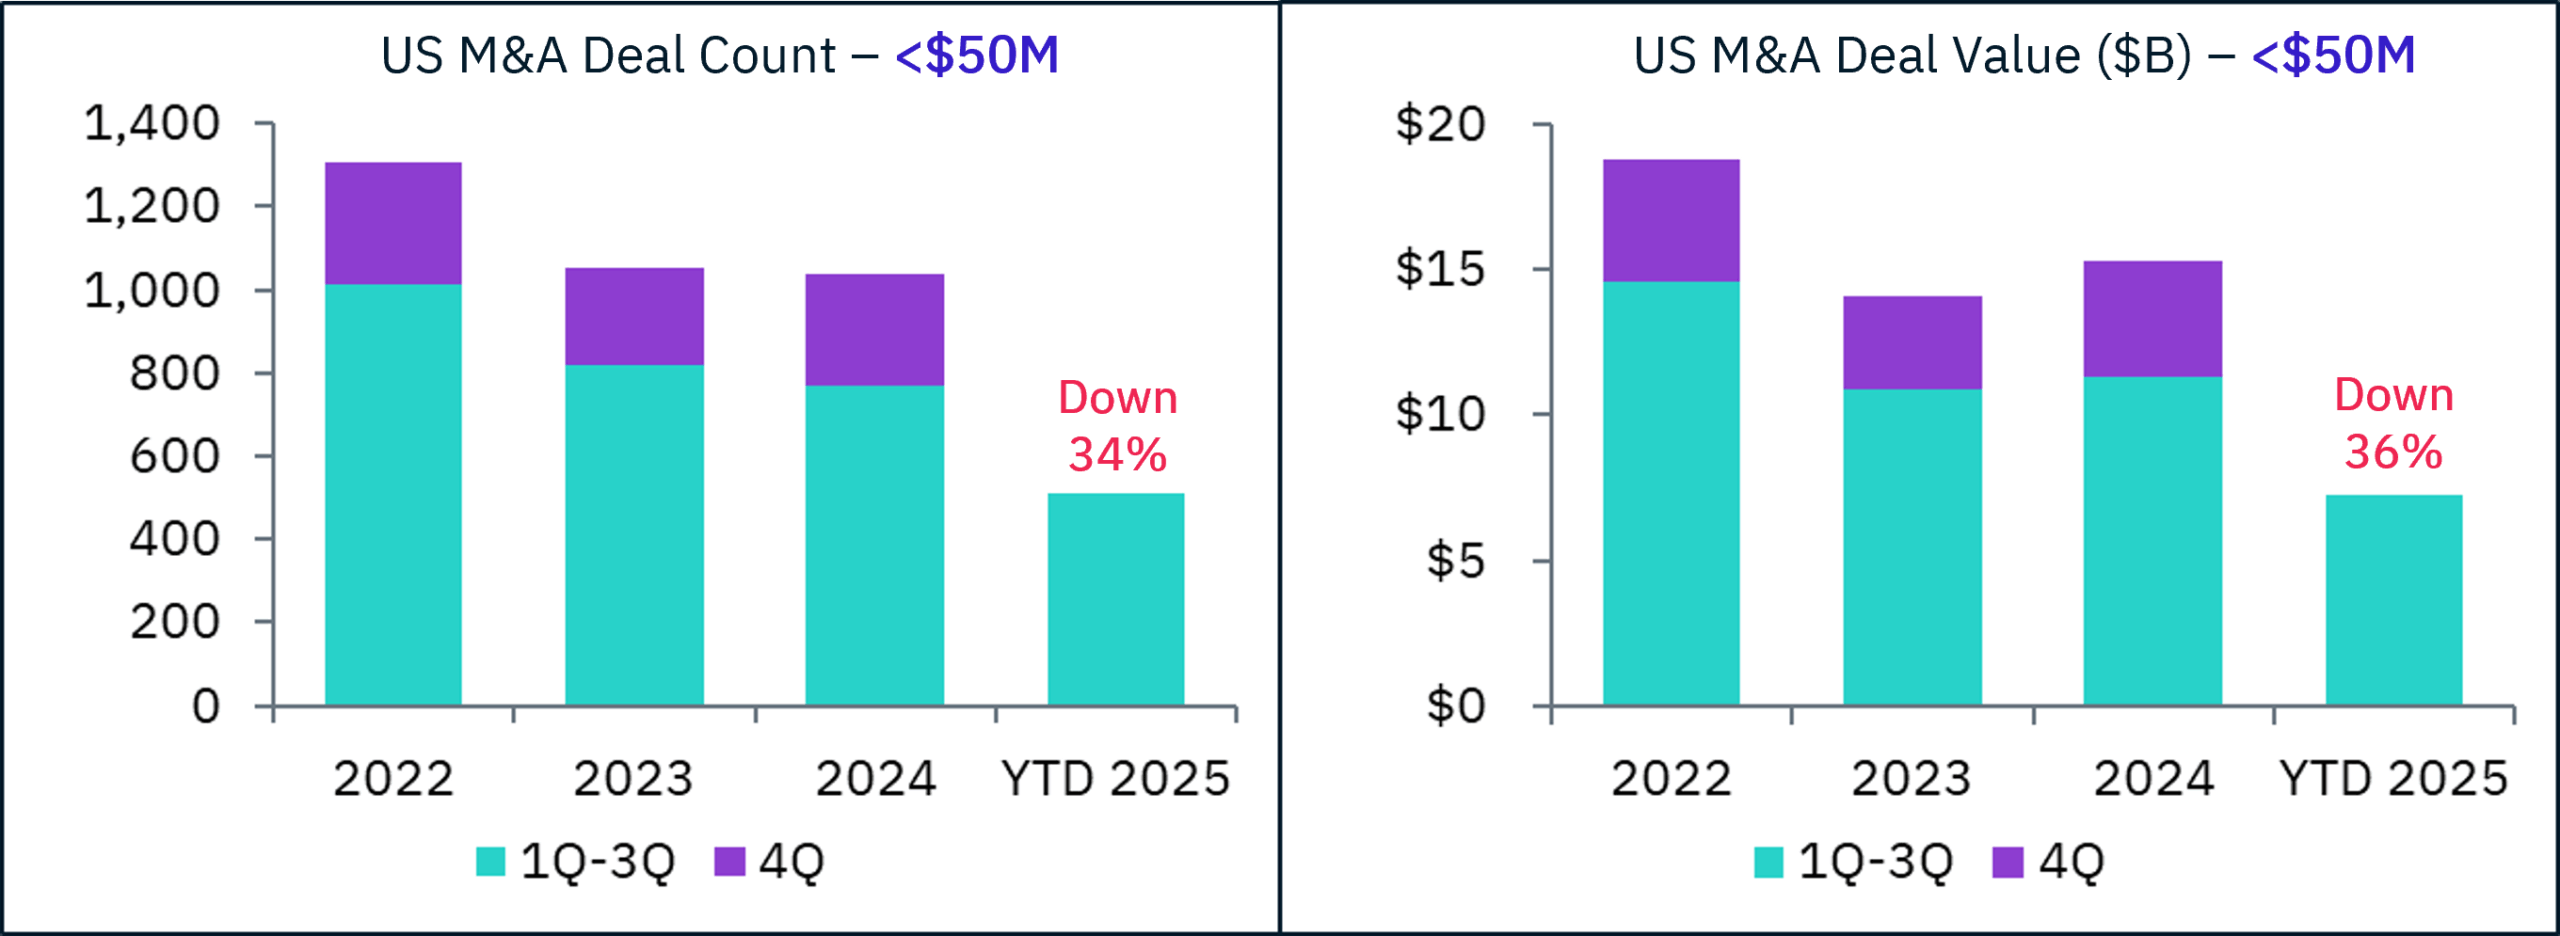
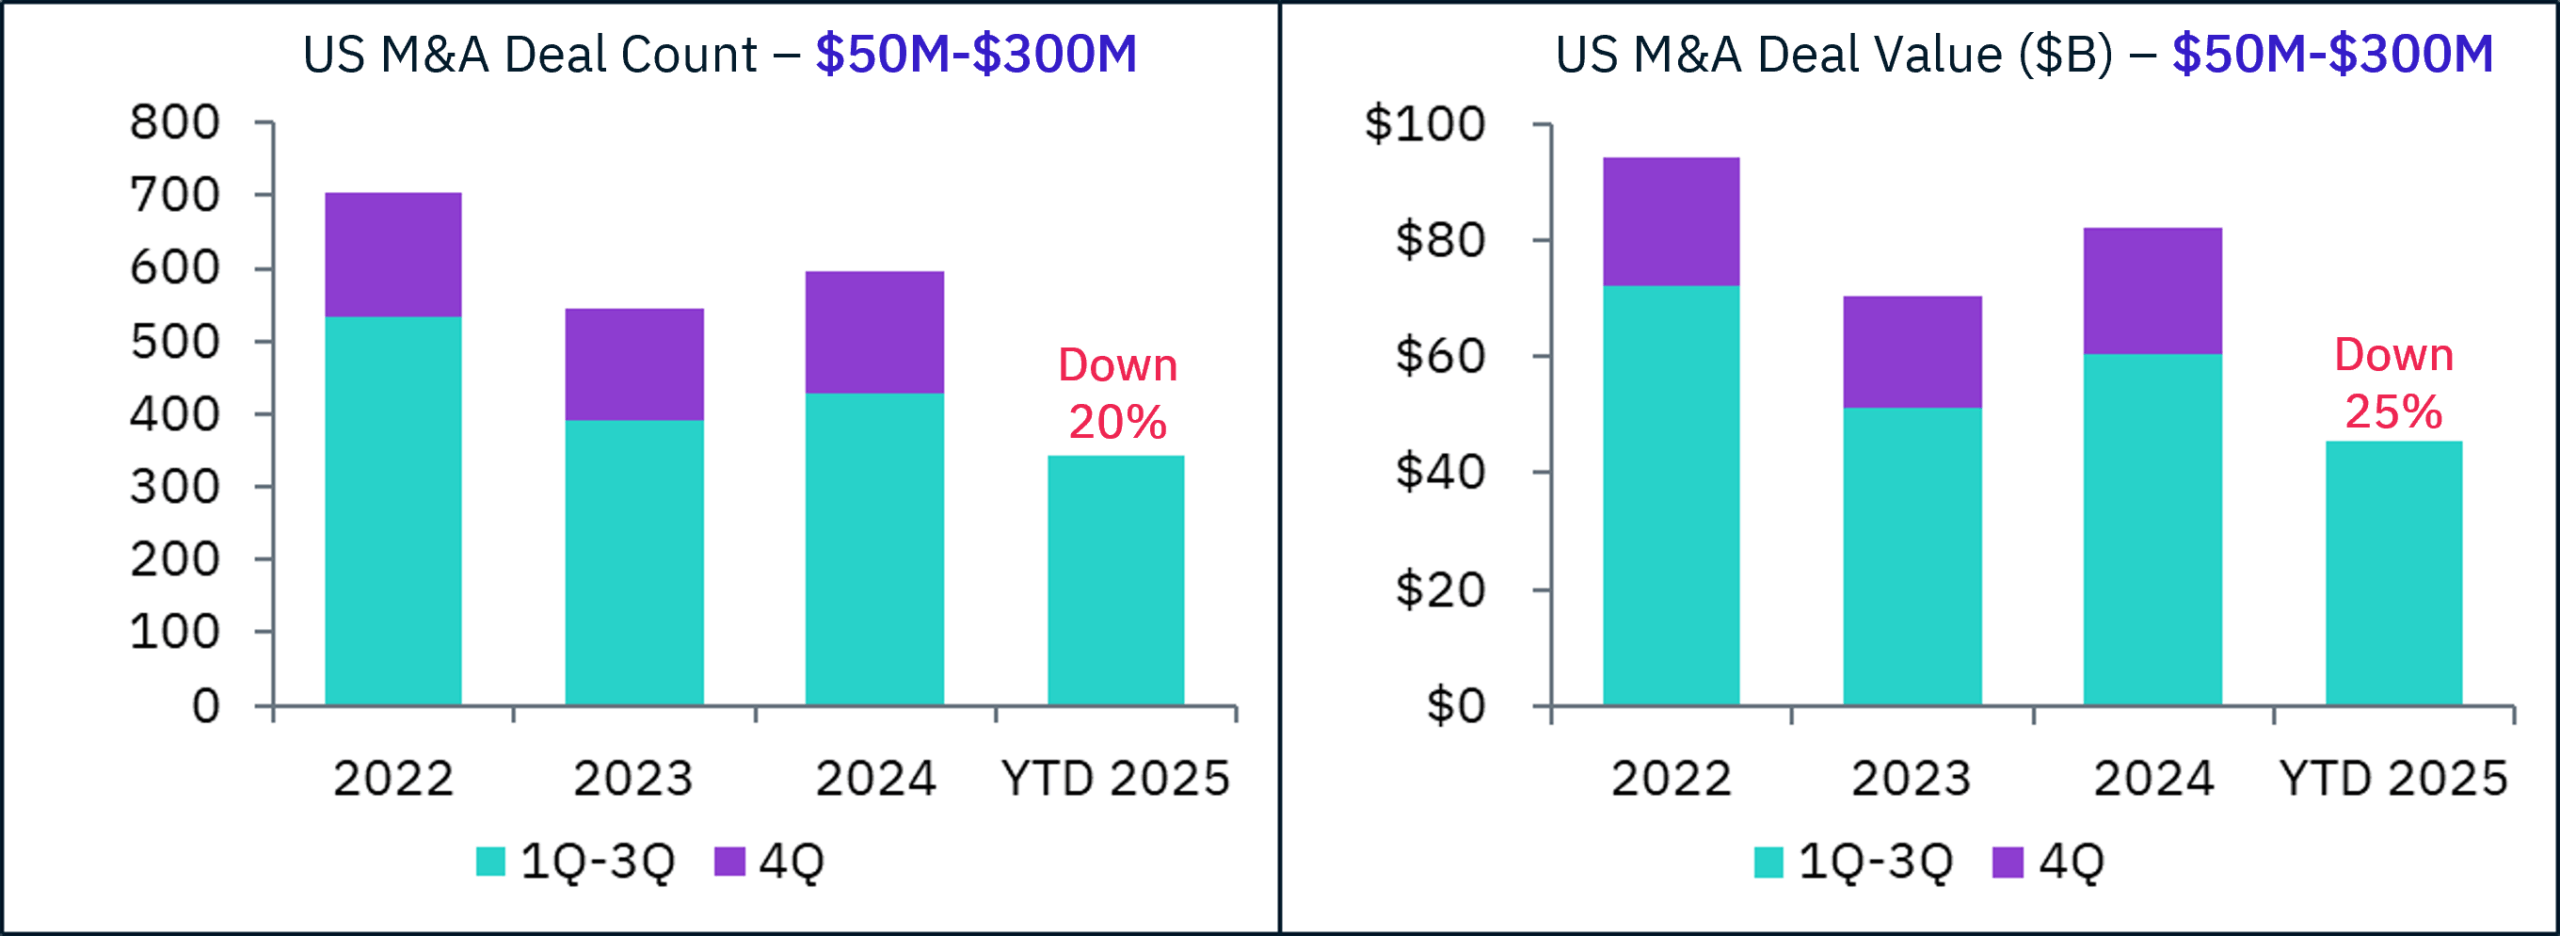
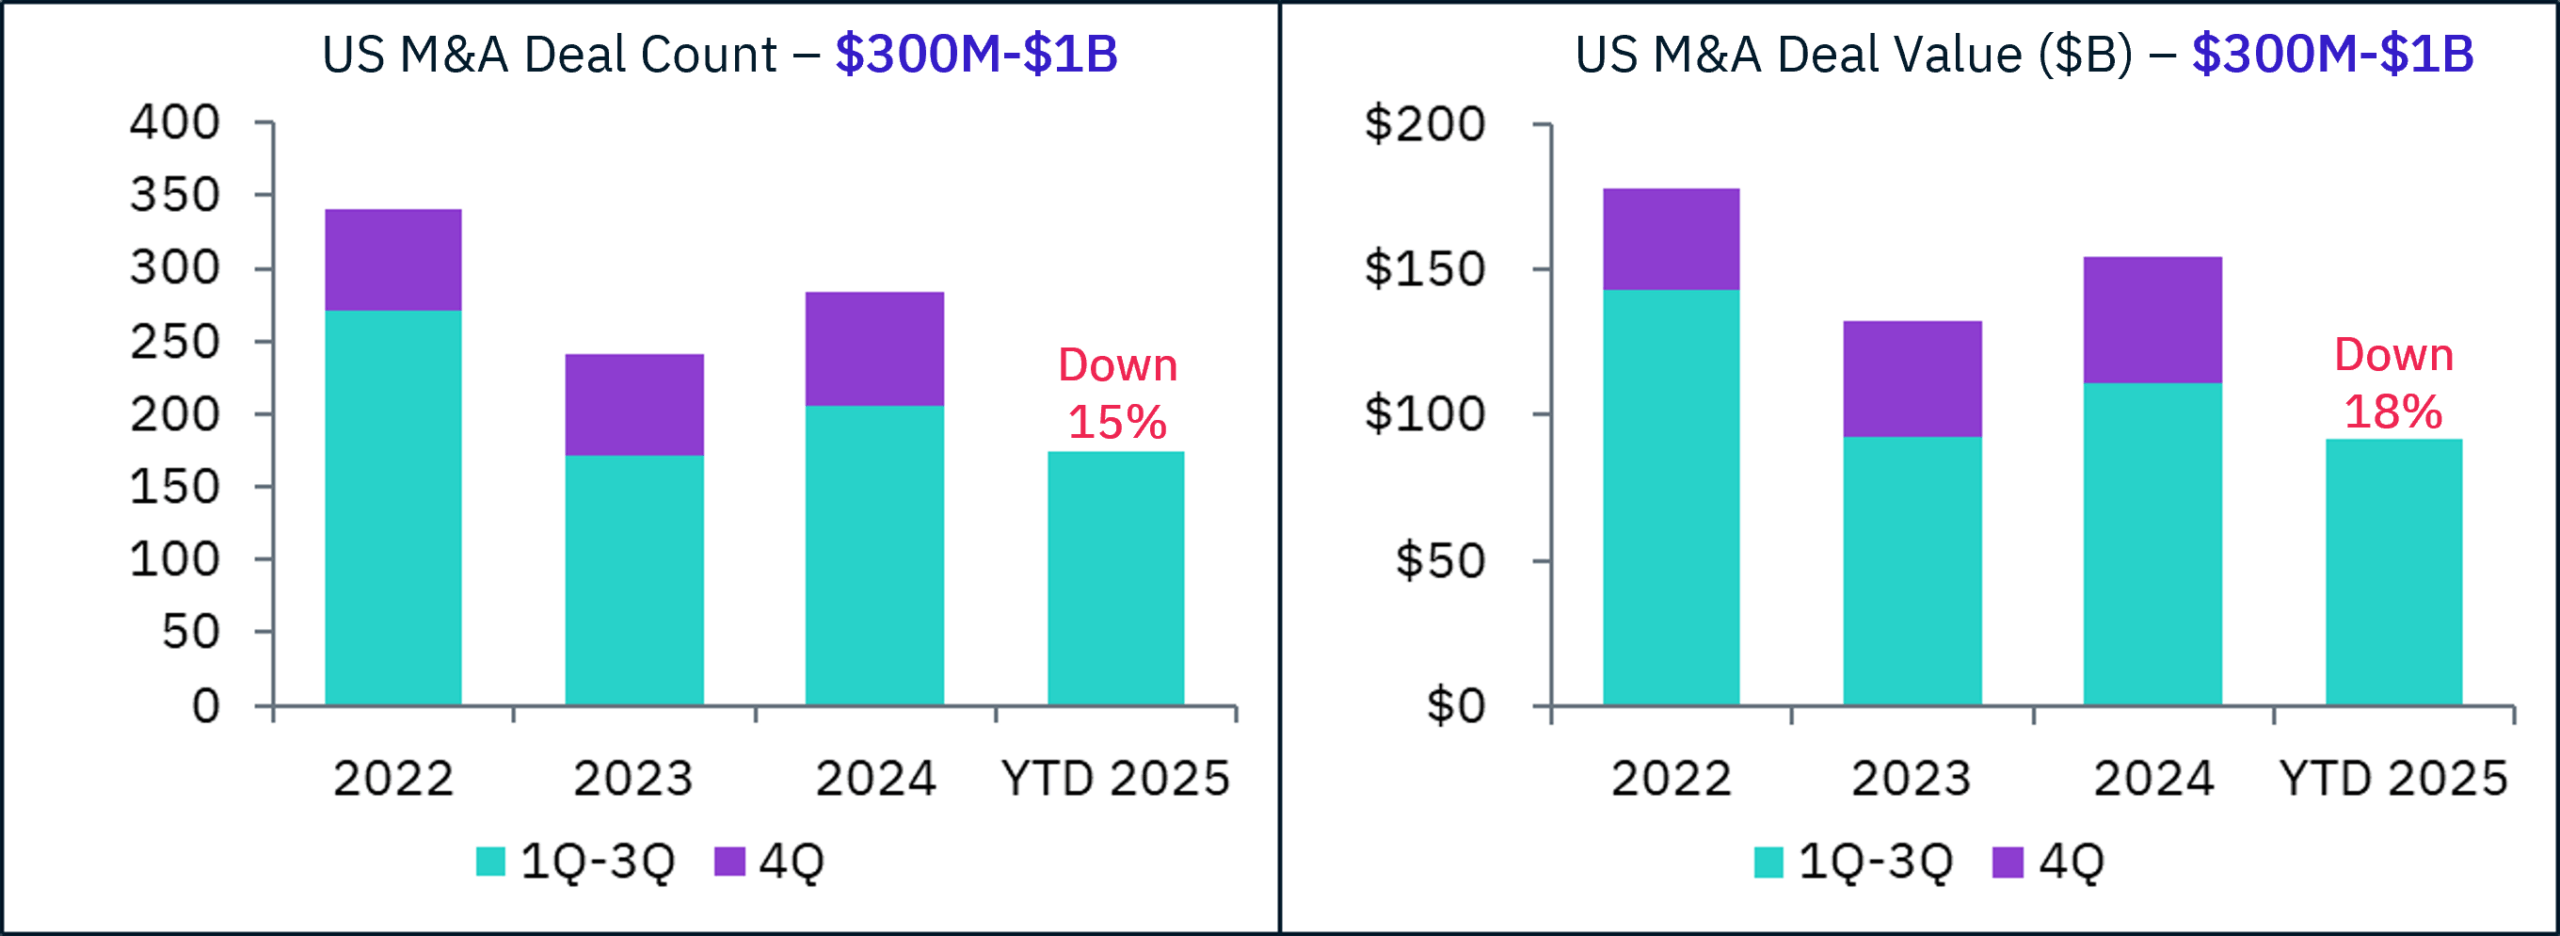
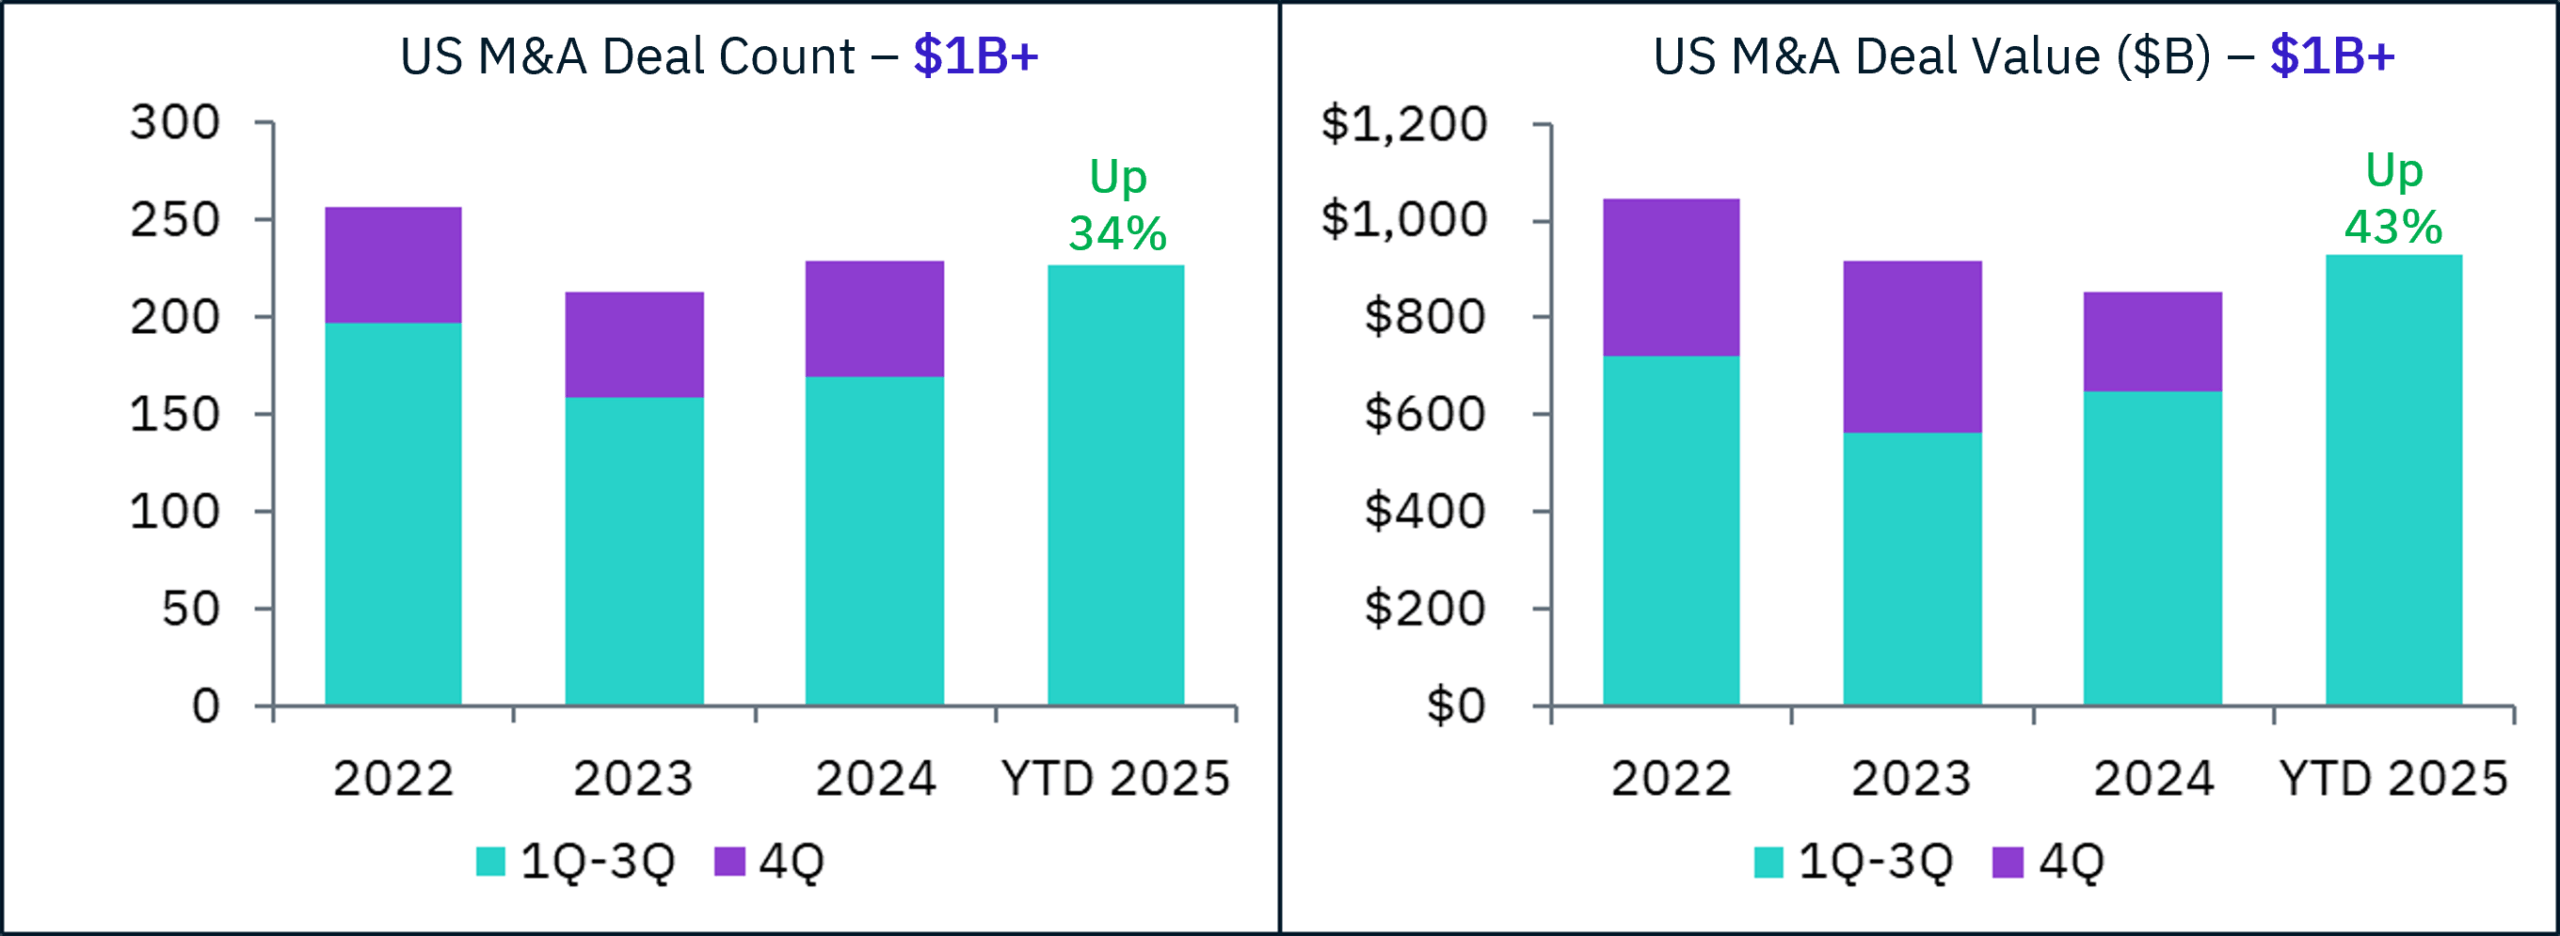
Clearly, the market for larger deals has outperformed, while sub $1B deals have underperformed, a trend we first spotted in May.
To our core constituency – companies, entrepreneurs and investors targeting $50M-$300M exits – this may seem like an ominous trend, but we have a different perspective. This is just part of a natural M&A cycle, one that we’ve lived through many times. When M&A markets strengthen, growth tends to start with the larger deals first, before trickling down to the mid-market. We believe the current surge of $1B+ deals is a positive indicator for increased M&A activity coming across the valuation spectrum.
Of course, M&A is not the only way to exit. The IPO market has picked up as of late, or has it?
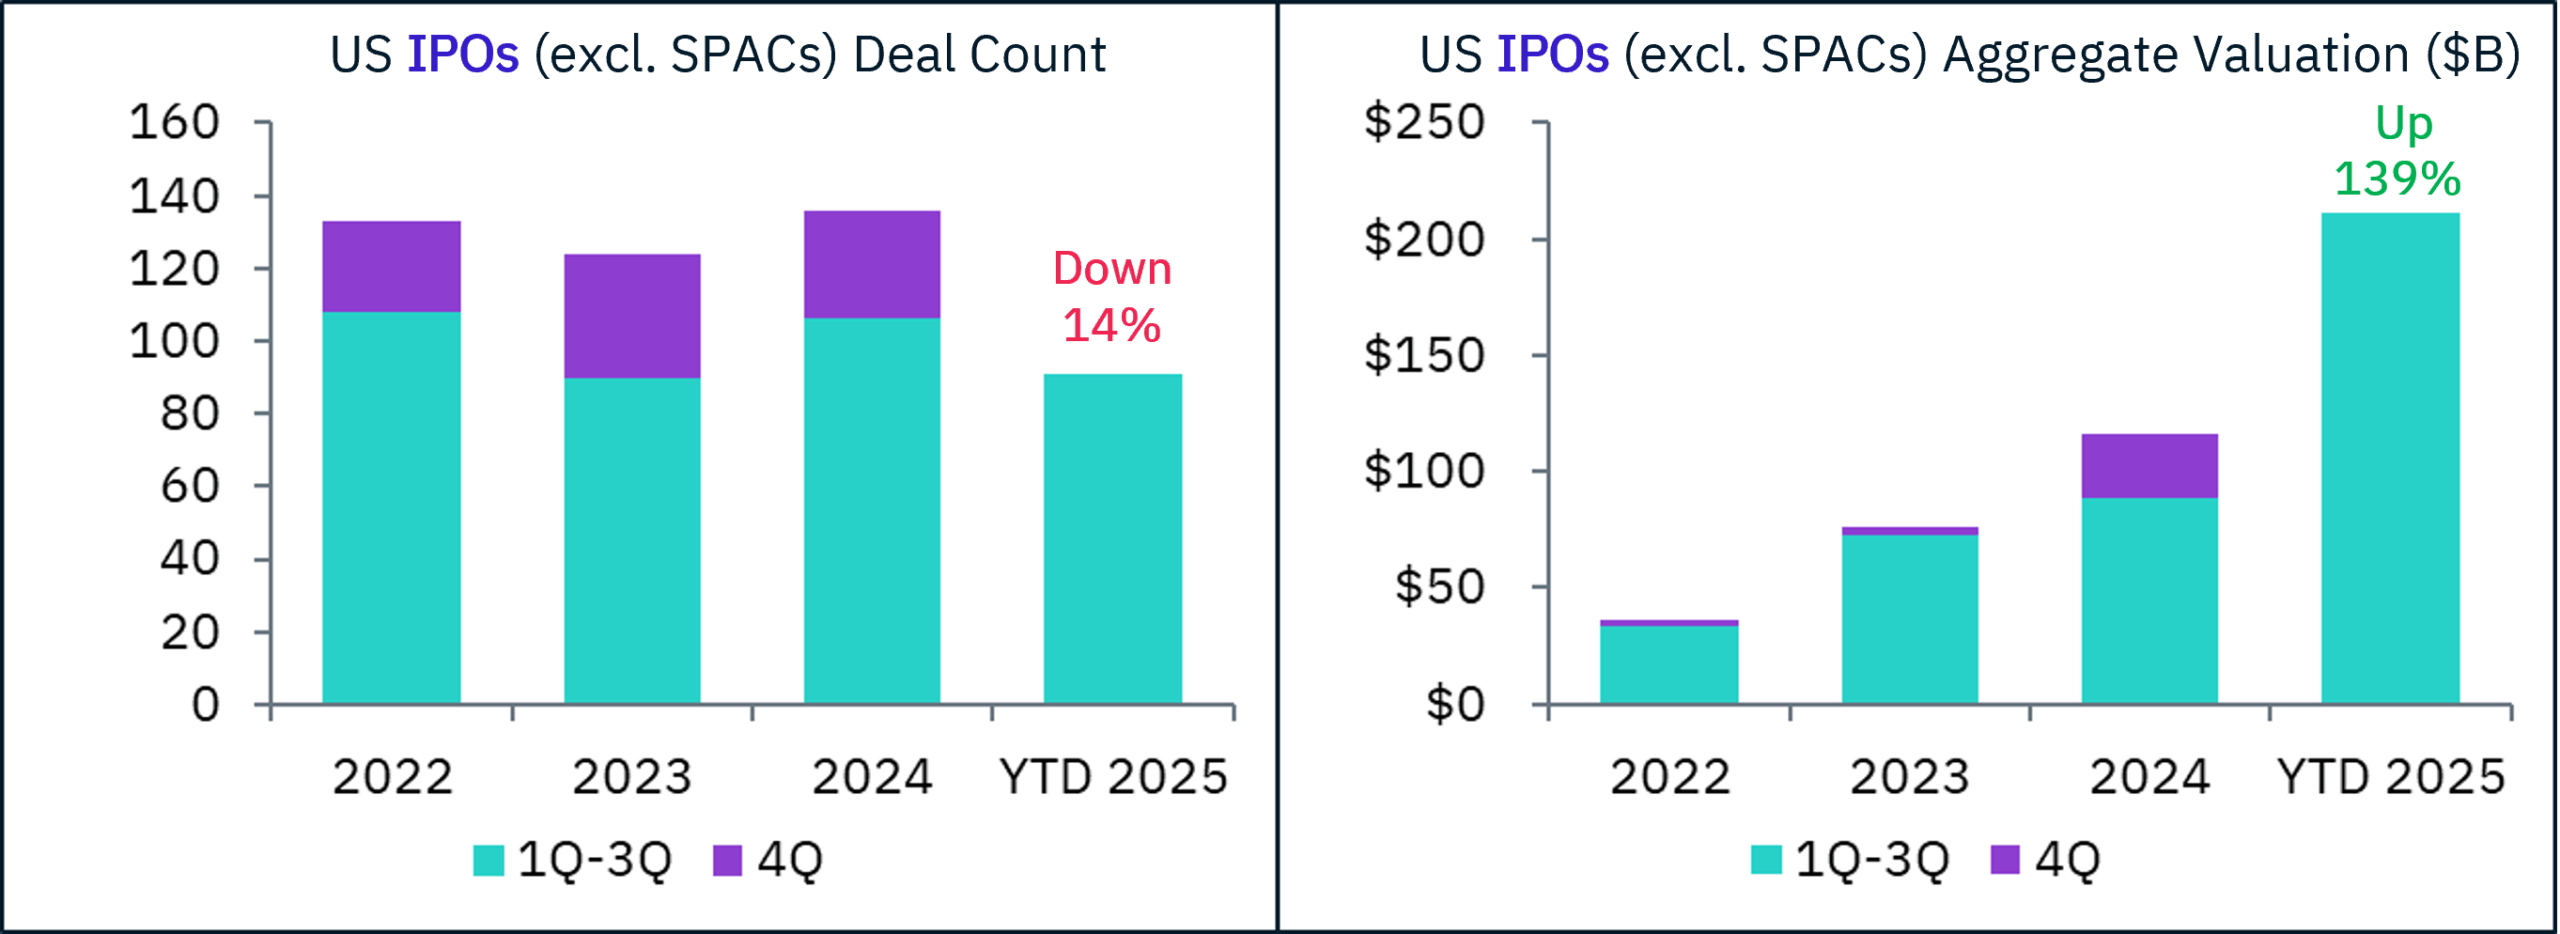
When you exclude SPACs, IPO deal count is actually down year over year. But we’re seeing the same dynamic as with IPOs. Aggregate IPO valuation is up 139%. Digging in a little further, the average IPO this year has been priced at a valuation of $2.8B, vs. $1.2B a year ago and $619M in 2022. It appears the threshold for going public has increased significantly.
Finally, let’s finish with SPAC IPOs and de-SPAC mergers. Most de-SPACs continue to trade below their $10.00 IPO price, making de-SPAC valuations a useless metric, so we’ll just focus on deal counts.
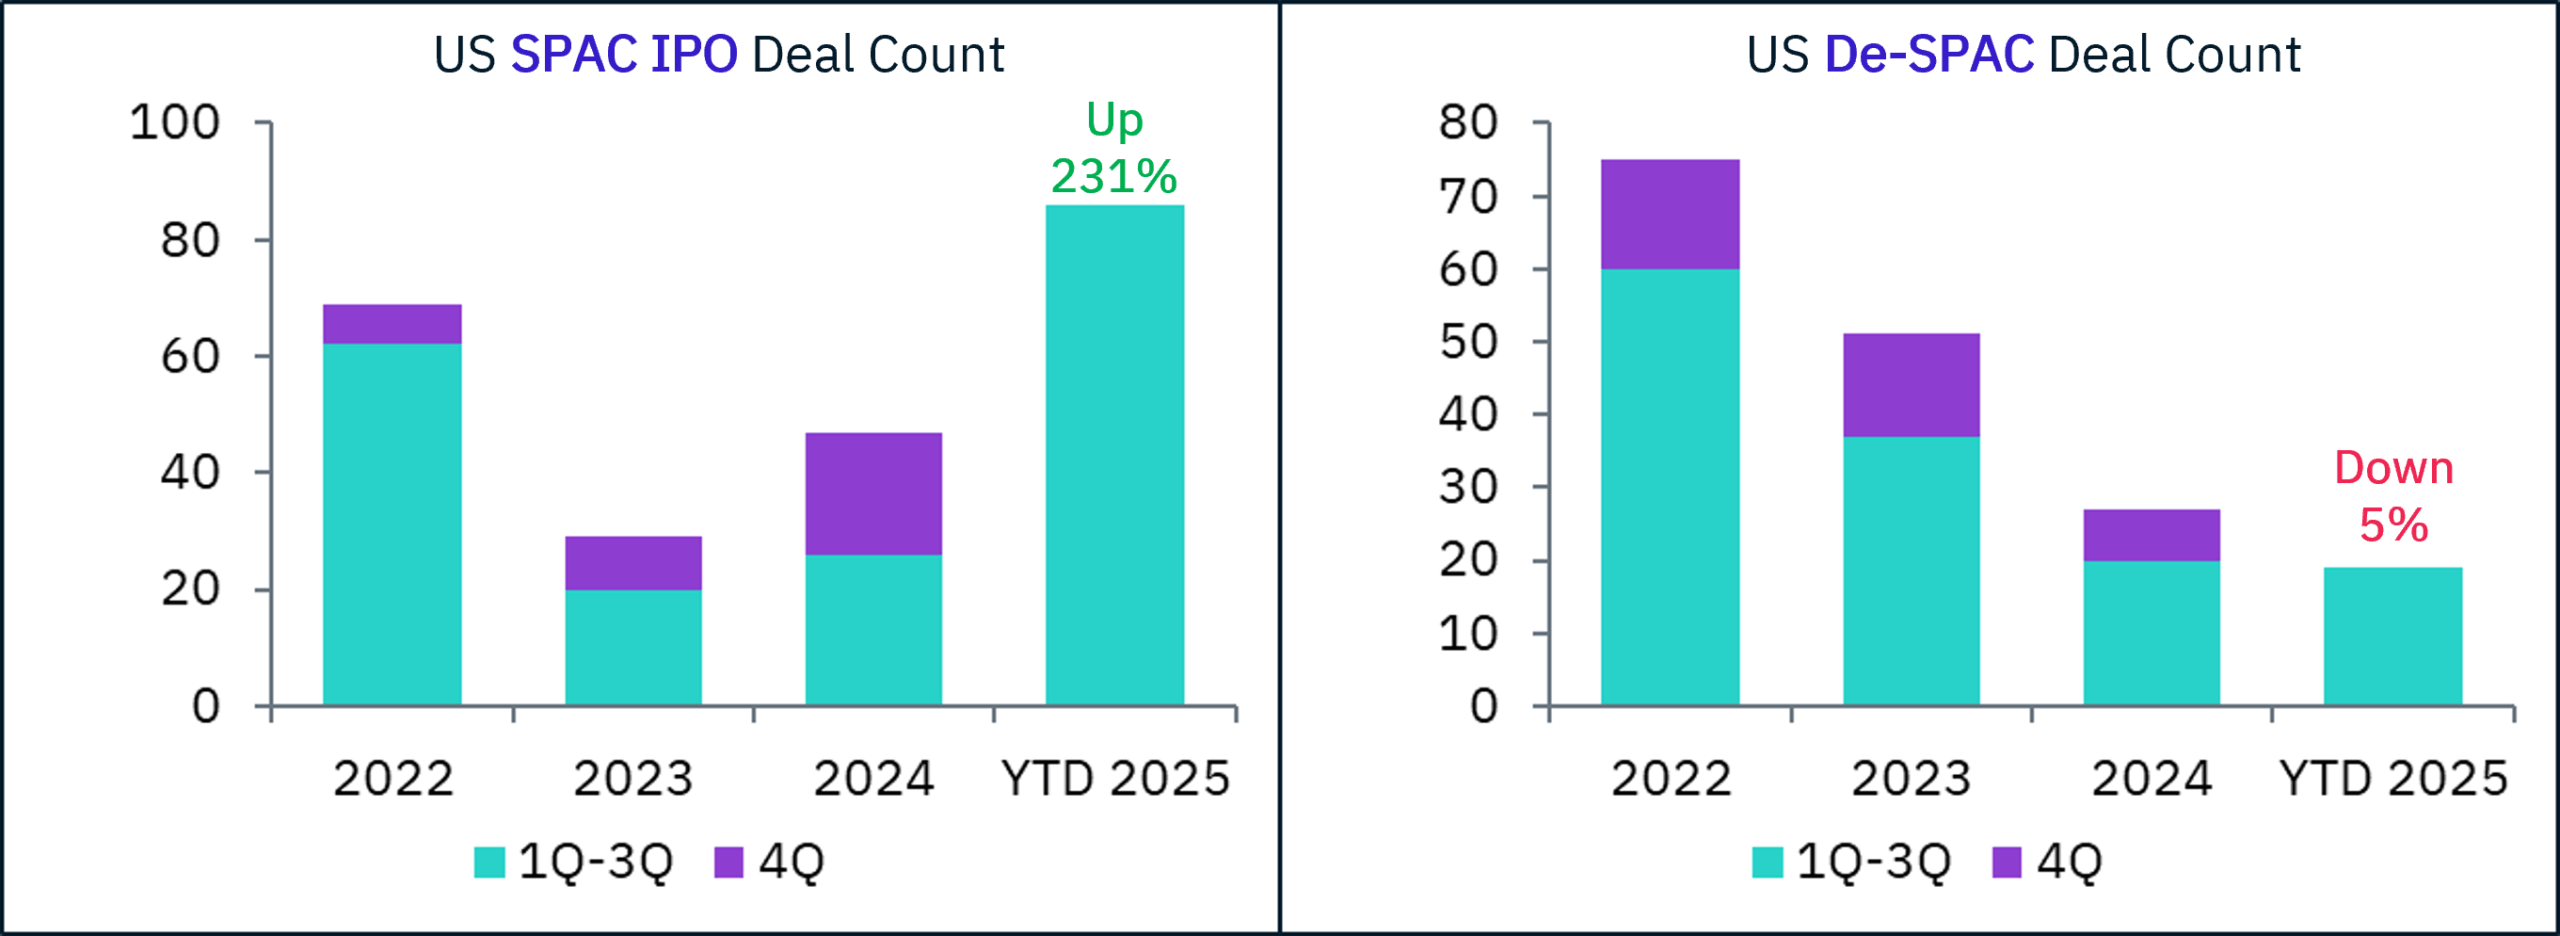
Everything is a cycle. Just like in 2021, we’ve got a backlog building – we should expect 2026 to be a bigger year for de-SPACs.
While some have found forecasting 2025 to be confounding, our thinking was quite simple. The uncertainty of the Trump administration’s tariffs would be outweighed by the ever increasing onslaught of AI. And the data seems to bear that out. Over the next 12 months, we look for non-Mag7 tech buyers to coalesce around their internal AI strategies, driving 2026 M&A activity.