News

News
FTFL - Clash of the Titans
This article appeared in our October 2025 issue of From the Front Lines, Bowen’s roundup of news and trends that educate, inspire and entertain us. Click here to subscribe.
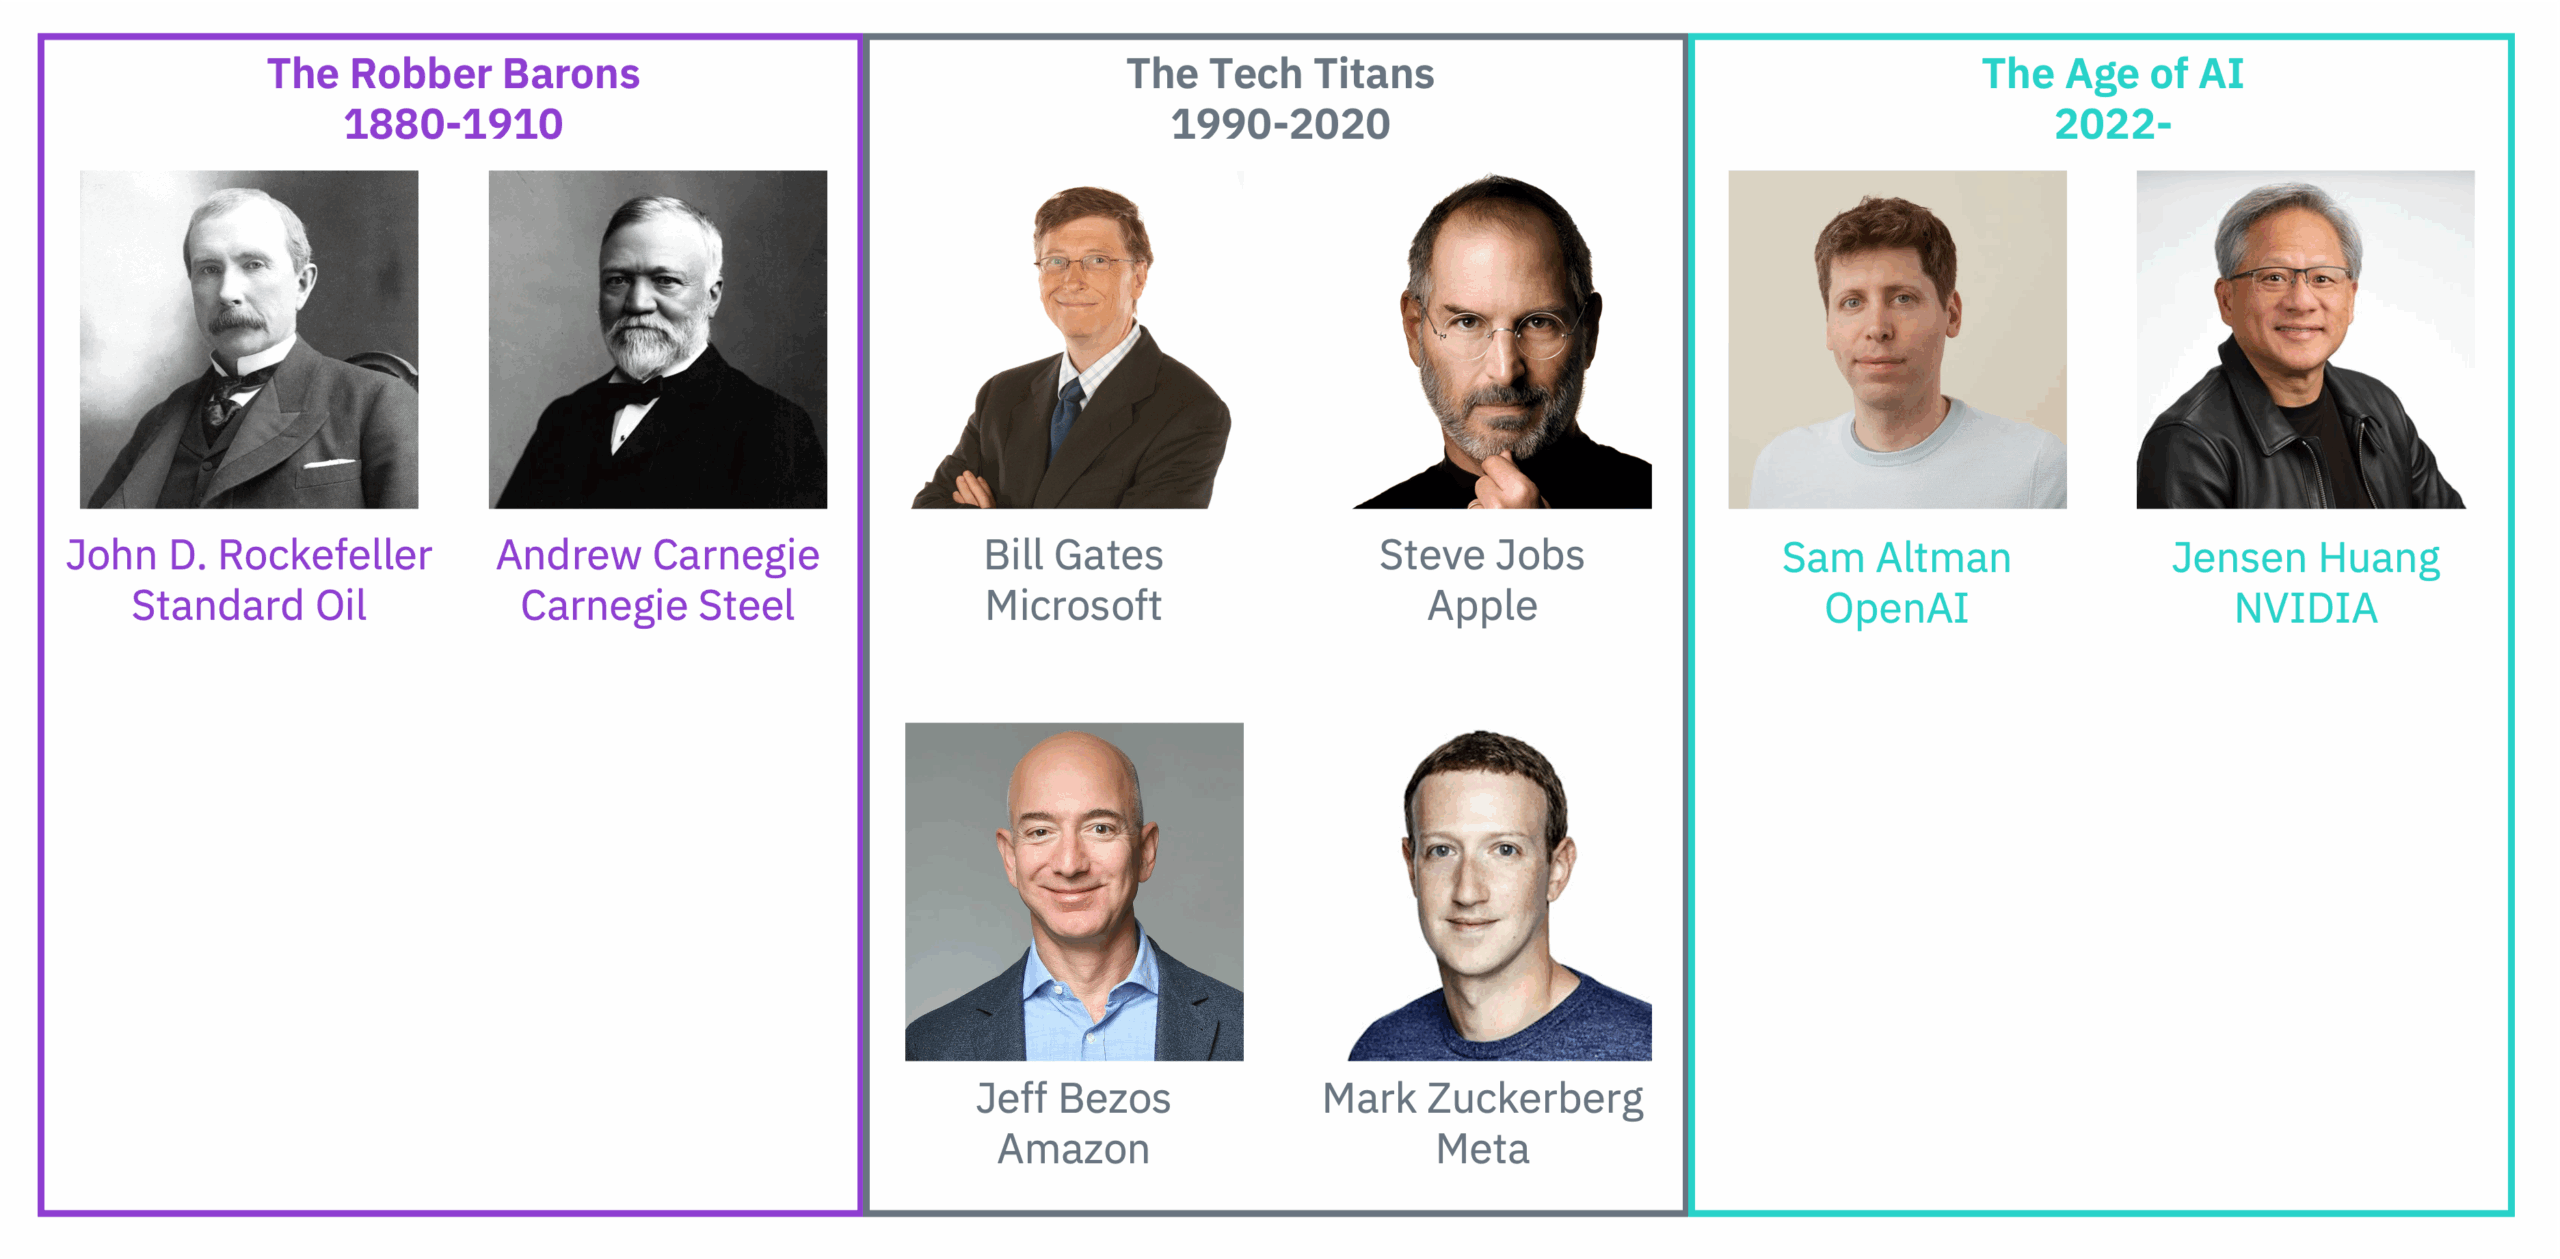
For October’s FTFL, we posed a question to ourselves: which period in US history saw the greatest wealth creation and concentration of market power? We focus on three eras where companies led by individual visionaries drove massive economic upheaval:
Let’s start with the individuals themselves. While a crude measure of market power, Forbes made measuring wealth into a sport. So let’s check out the stats.
Whose business acumen earned themselves the highest return? We looked at estimated peak net worth and adjusted it to today’s dollars.
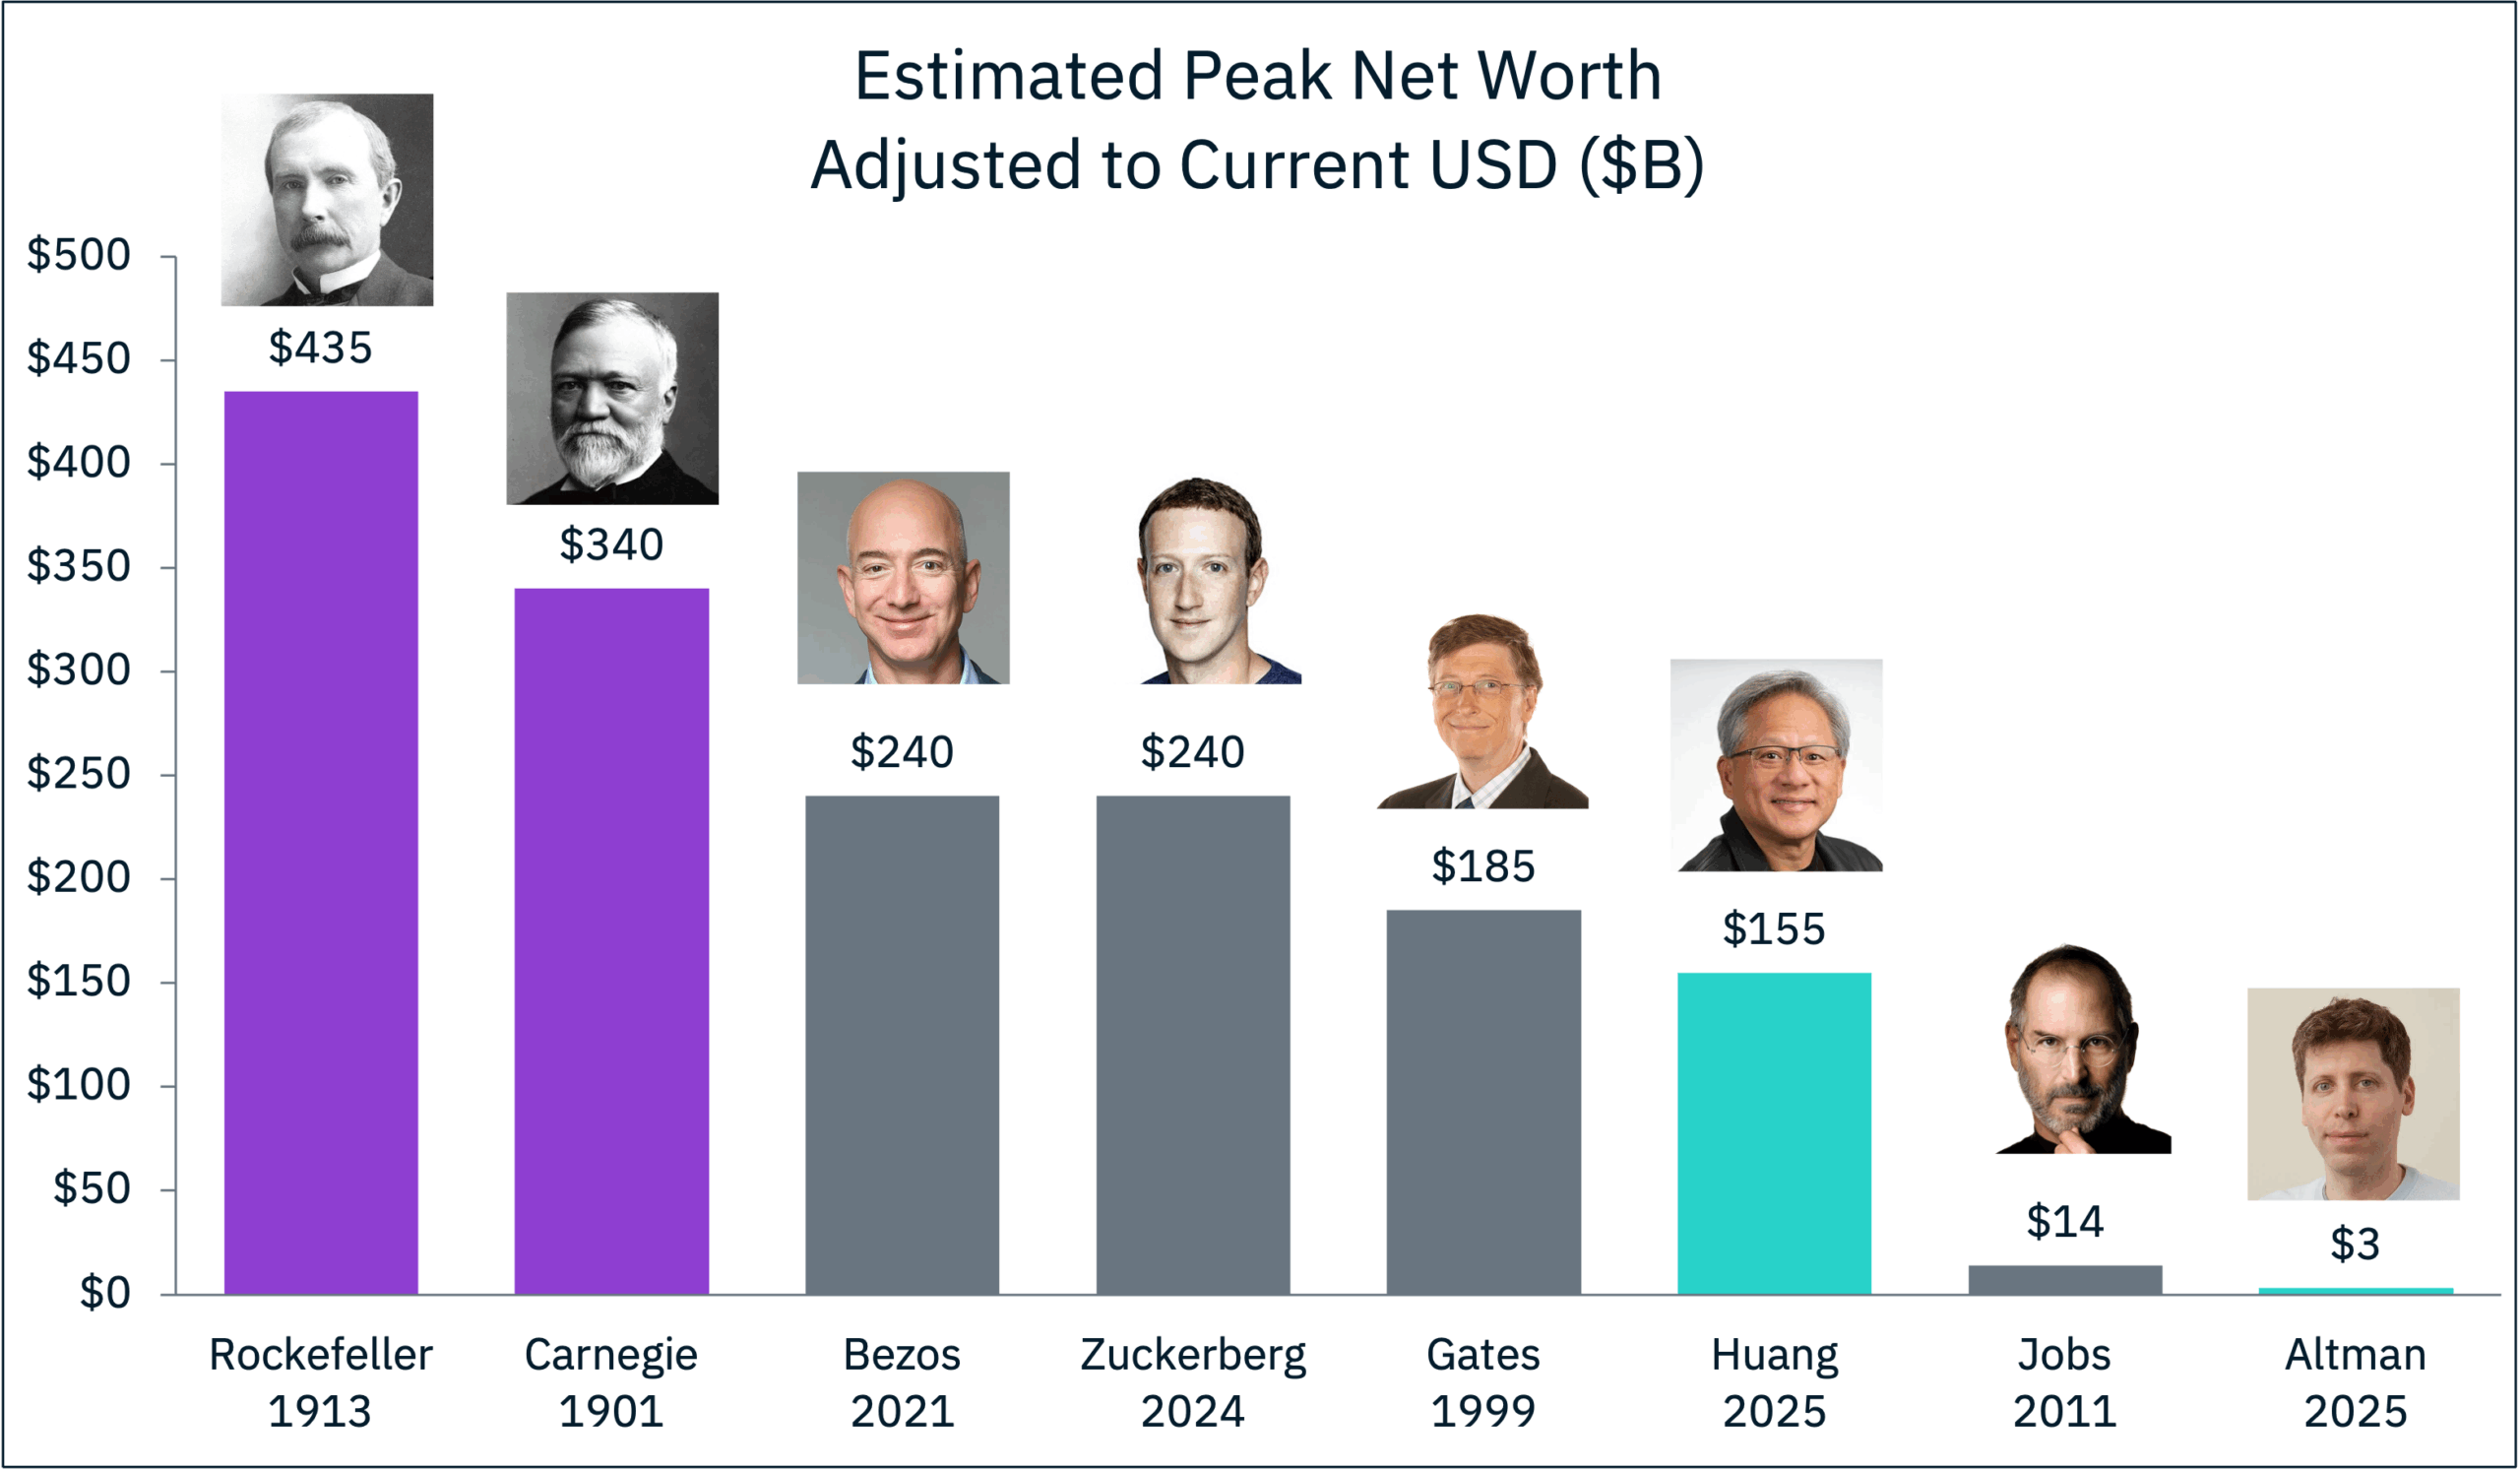
The Robber Barons are still kings of the mountain – it appears century-old antitrust legislation has worked to some extent (more on that in the next chart). A couple interesting notes on the other end of the scale. 1) Apple didn’t make Steve Jobs rich, Disney did. And 2) Sam Altman holds no direct equity in OpenAI, although that may change if they ever restructure to a for-profit company [10/28/2025 update – per the New York Times, Altman does not have a significant stake in the company’s new for-profit structure].
Now let’s look at the companies these individuals built and the market power they achieved.
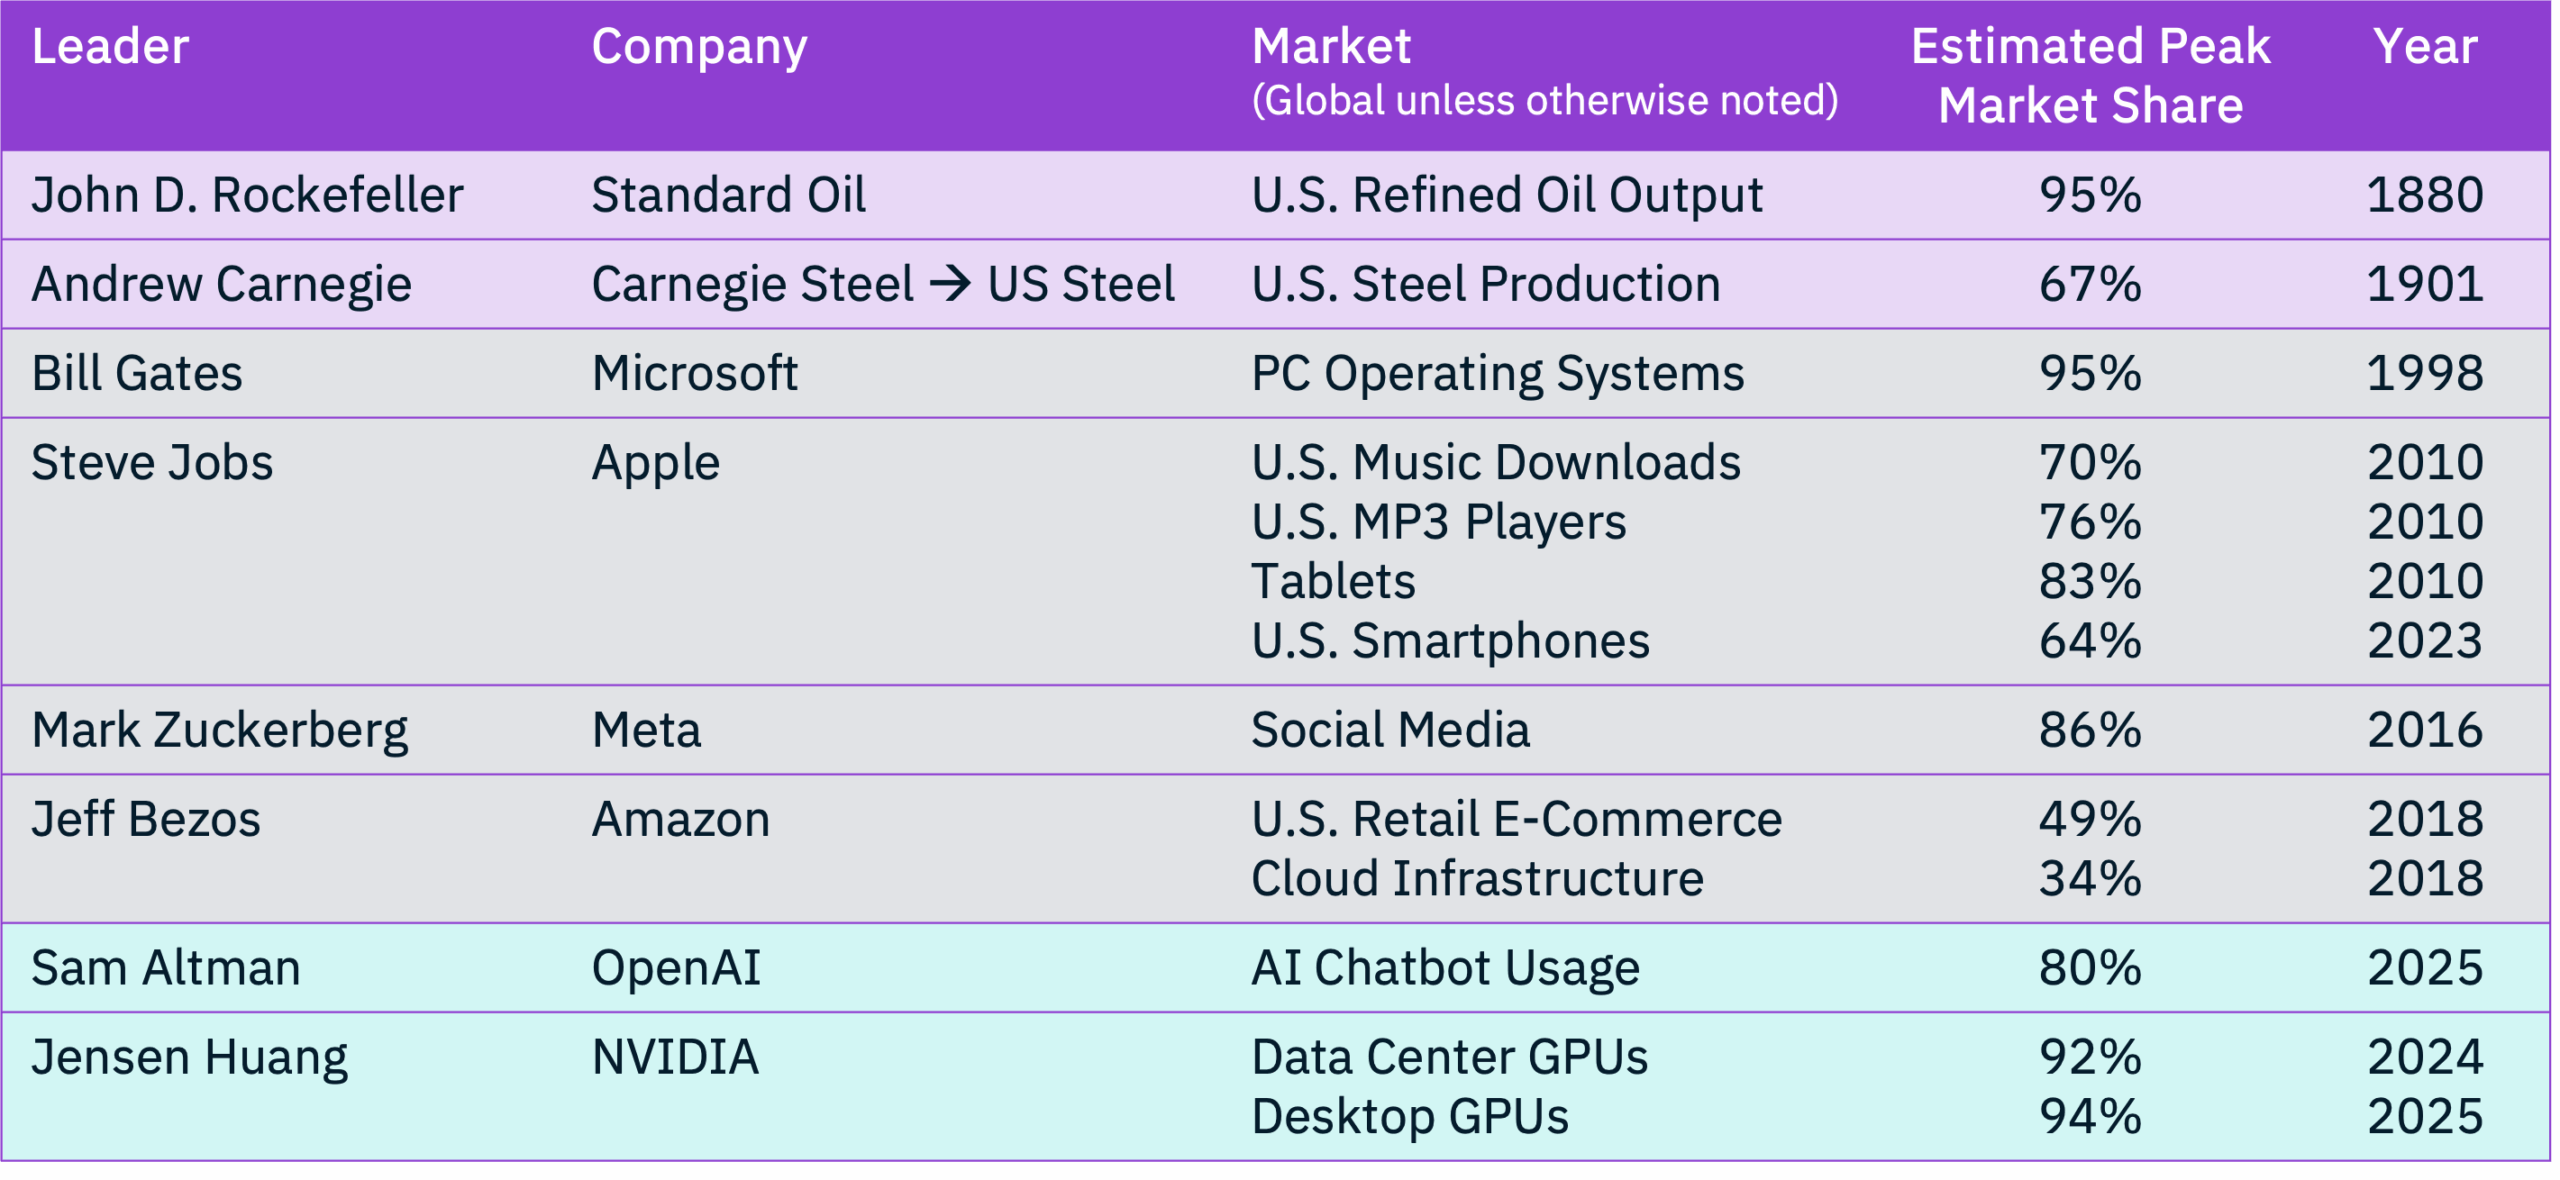
Time to break up NVIDIA!
While Rockefeller’s market dominance set the standard (pun intended) for antitrust action, regulators have been far less successful recently, with the DOJ and FTC having tried and failed to break up Microsoft, Apple, Meta, Amazon and Google over the past 30 years. But in the long run, the fast-changing nature of tech markets tend to give monopolies less staying power over consumers – e.g., our MDs may still be on Facebook, but our bullpen is on TikTok.
Finally, let’s look at the broader impact of the US economy. These Masters of the Universe were at the forefront of their respective industries – their companies’ growth drove growth across their ecosystems. And in turn, their sector growth was critical to the US economy.
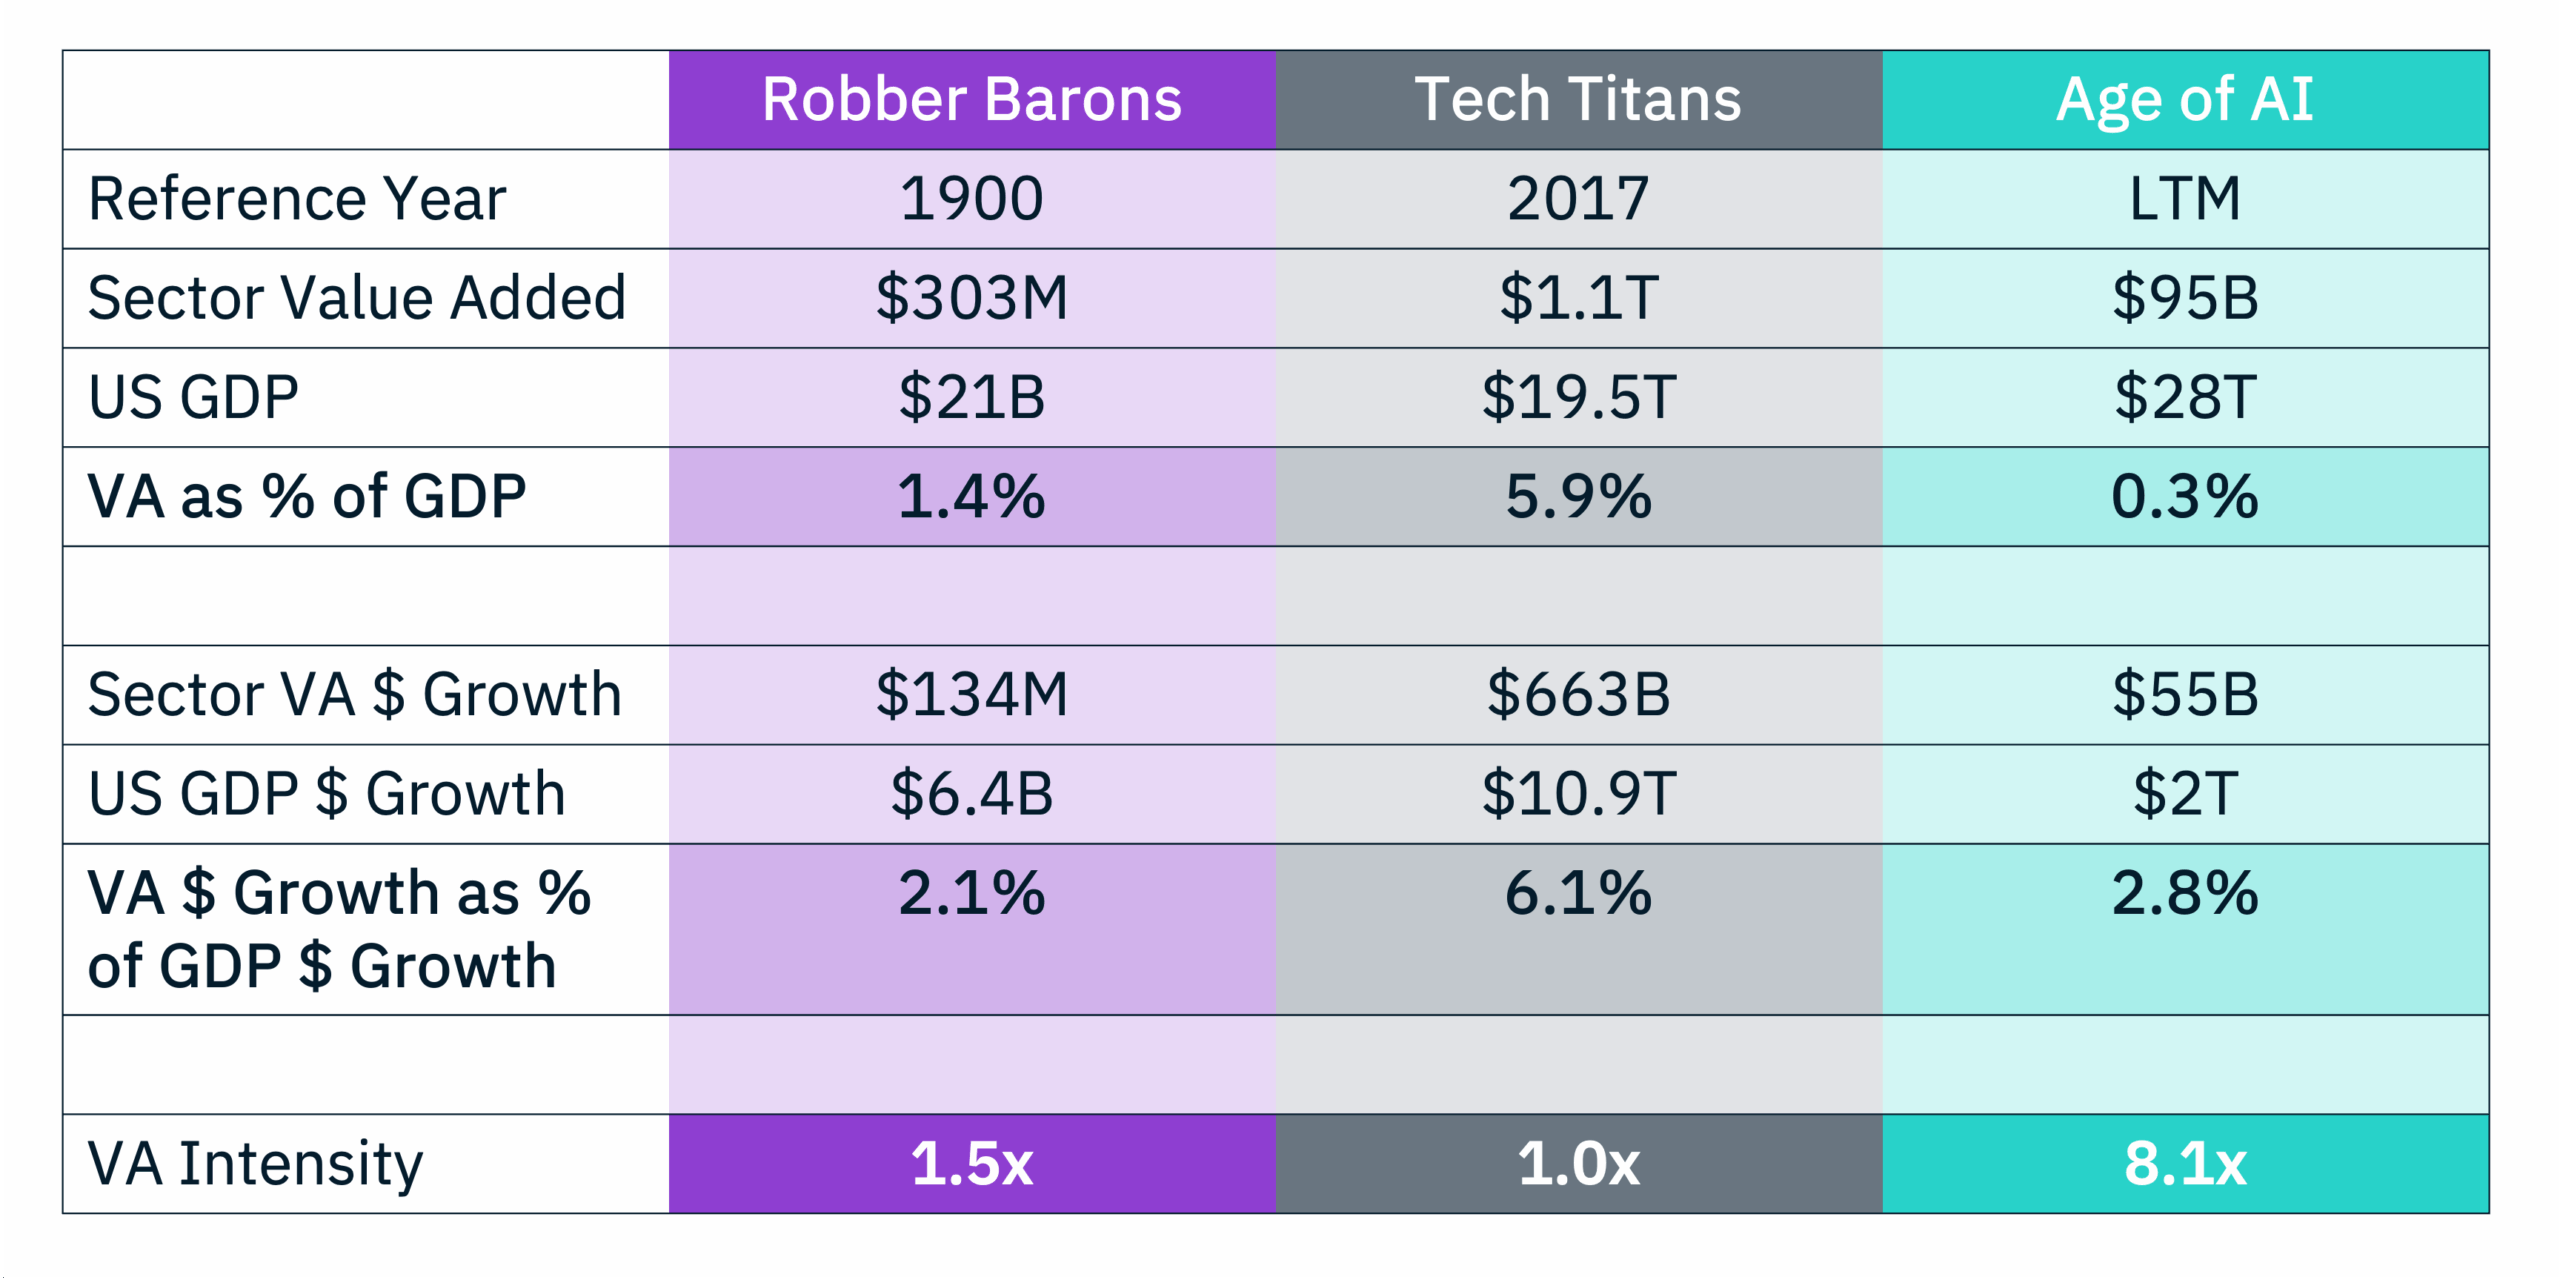
We looked at US GDP during each era, then used available data and estimates to come up with sector value added (VA) to GDP. We analyzed each era’s VA as a percentage of US GDP to see the relative size of each era’s industry. Then we calculated each era’s VA dollar growth as a percentage of US GDP dollar growth, to see each era’s contribution to the US economy’s growth. VA growth % divided by VA % gets us a metric we call VA Intensity. A VA Intensity of 1x means the industry’s growth contribution is in line with the industry’s size. The higher the intensity value, the greater the contribution to growth relative to its size. Let’s see how the eras stack up.
(Sources below)
Perhaps it should not come as a surprise, but US GDP has grown >3 orders of magnitude (ponder that math majors!) in 125 years. But the headline here – which has been written elsewhere – is if you take AI out of the current US GDP, economic growth slows to a trickle. Said another way, 8.1x VA multiple is swinging WAY above its weight in the context of other periods.
The arc of business history is long and generally self-correcting. The Robber Barons existed in an era without a national income tax, far weaker unions, no Federal Trade Commission and no government run social safety programs. Those conditions will never exist again – but new ones will!
The Age of AI – with 8x Value Add highlighted above – is clearly thriving in a period of tariffs, partial government ownership (Intel @ 10%) and soaring valuations. Perhaps most intriguing is the “circular deal” trend, where even long-standing tech titans like Oracle have become highly relevant again.
Will this all hold? Stay tuned to see what the machines decide…
VA sources: Our Robber Baron numbers come from US Census data on iron & steel and petroleum refining. Tech Titan era data is represented by the Digital-Enabling Infrastructure segment from the US Bureau of Economic Analysis’ Digital Economy Satellite Account. AI era VA is estimated from data center output and revenues reported by NVIDIA, OpenAI, Anthropic, and other leading AI infrastructure and software firms.