
News

News
FTFL - Liquidity - Where Art Thou?
This article appeared in our November 2026 issue of From the Front Lines, Bowen’s roundup of news and trends that educate, inspire and entertain us. Click here to subscribe.
With less than 45 days left in the calendar year, we take stock of 2026 venture capital liquidity.
Just how robust of a year has it been for liquidity?
We asked several of our VC colleagues how they are feeling about this year. The consensus answer seems to be: meh.
Let’s see what the data says. First we looked at VC dollars in vs. VC dollars out.
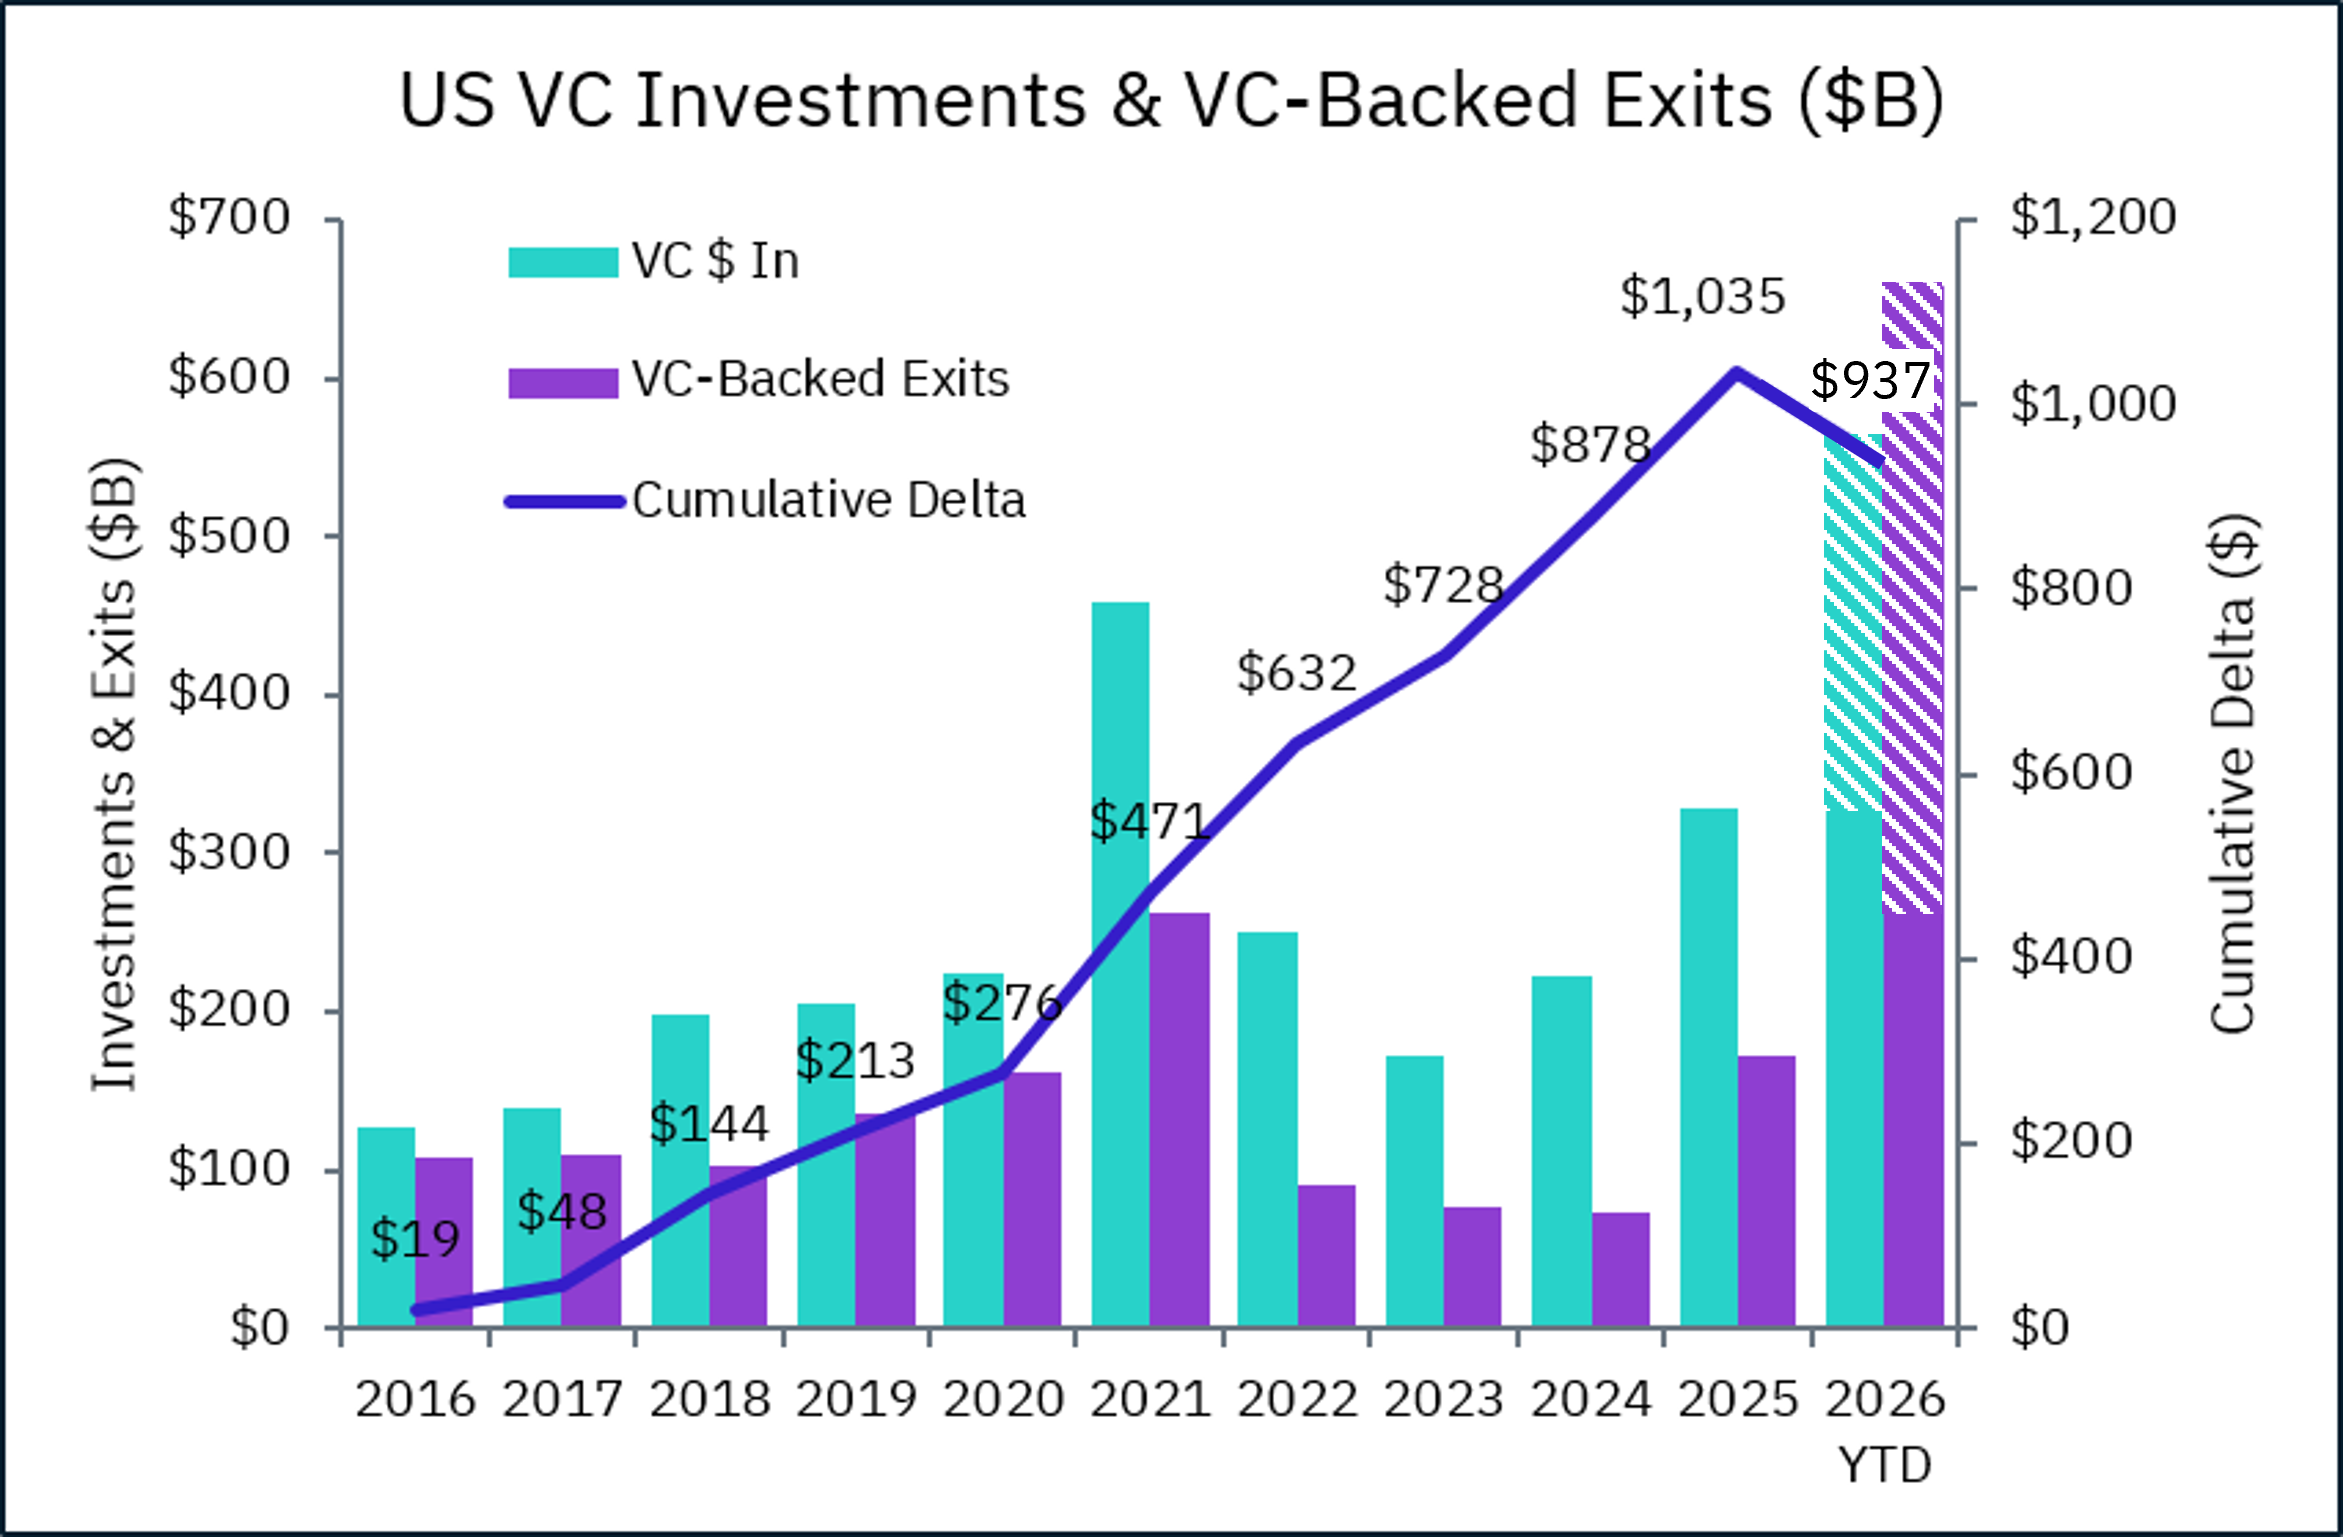
Every year from 2016 to 2025, US VC investments exceeded VC-backed exit proceeds (M&A and IPO), often by considerable margins. But 2026 seems to be a different story – YTD, exit values are at $659 billion, vs. total investments of $562 billion. What are our VC friends so glum about?
Well, you can’t analyze any VC metrics these days without accounting for super-mega-ultradeals. The striped sections of the 2026 bars above represent just three companies: OpenAI, Anthropic and SpaceX / xAI. If we remove those outliers from the dataset, 2026 still looks better than the prior 5 years, but not a complete trend reversal. Whether or not you include those behemoths, the cumulative delta between investments and exits over the last 10 years, indicated by the blue line in the chart, sits at around $1 trillion. (If that delta were a country, it would have the 23rd largest GDP in the world, just behind Taiwan.)
Before we leave the land of giants, let’s dig into some Unicorn numbers. Since 2016, 2,496 Unicorns have been formed. Where are they now?
- 589, or 23%, have exited via M&A or IPO
- Another 40, or 2%, have gone out of business
- Leaving 1,867, or 75% that remain private
The aggregate valuation of these 1,867 Unicorns is nearly $8 trillion (note this is down from $9 trillion prior to Anthropic’s IPO!).
VC portfolio company investments and exits only tell part of the story. Let’s take a look at the fund side. Using PitchBook’s quarterly US VC report, we can track VC distributions vs. contributions over the last 10 years.
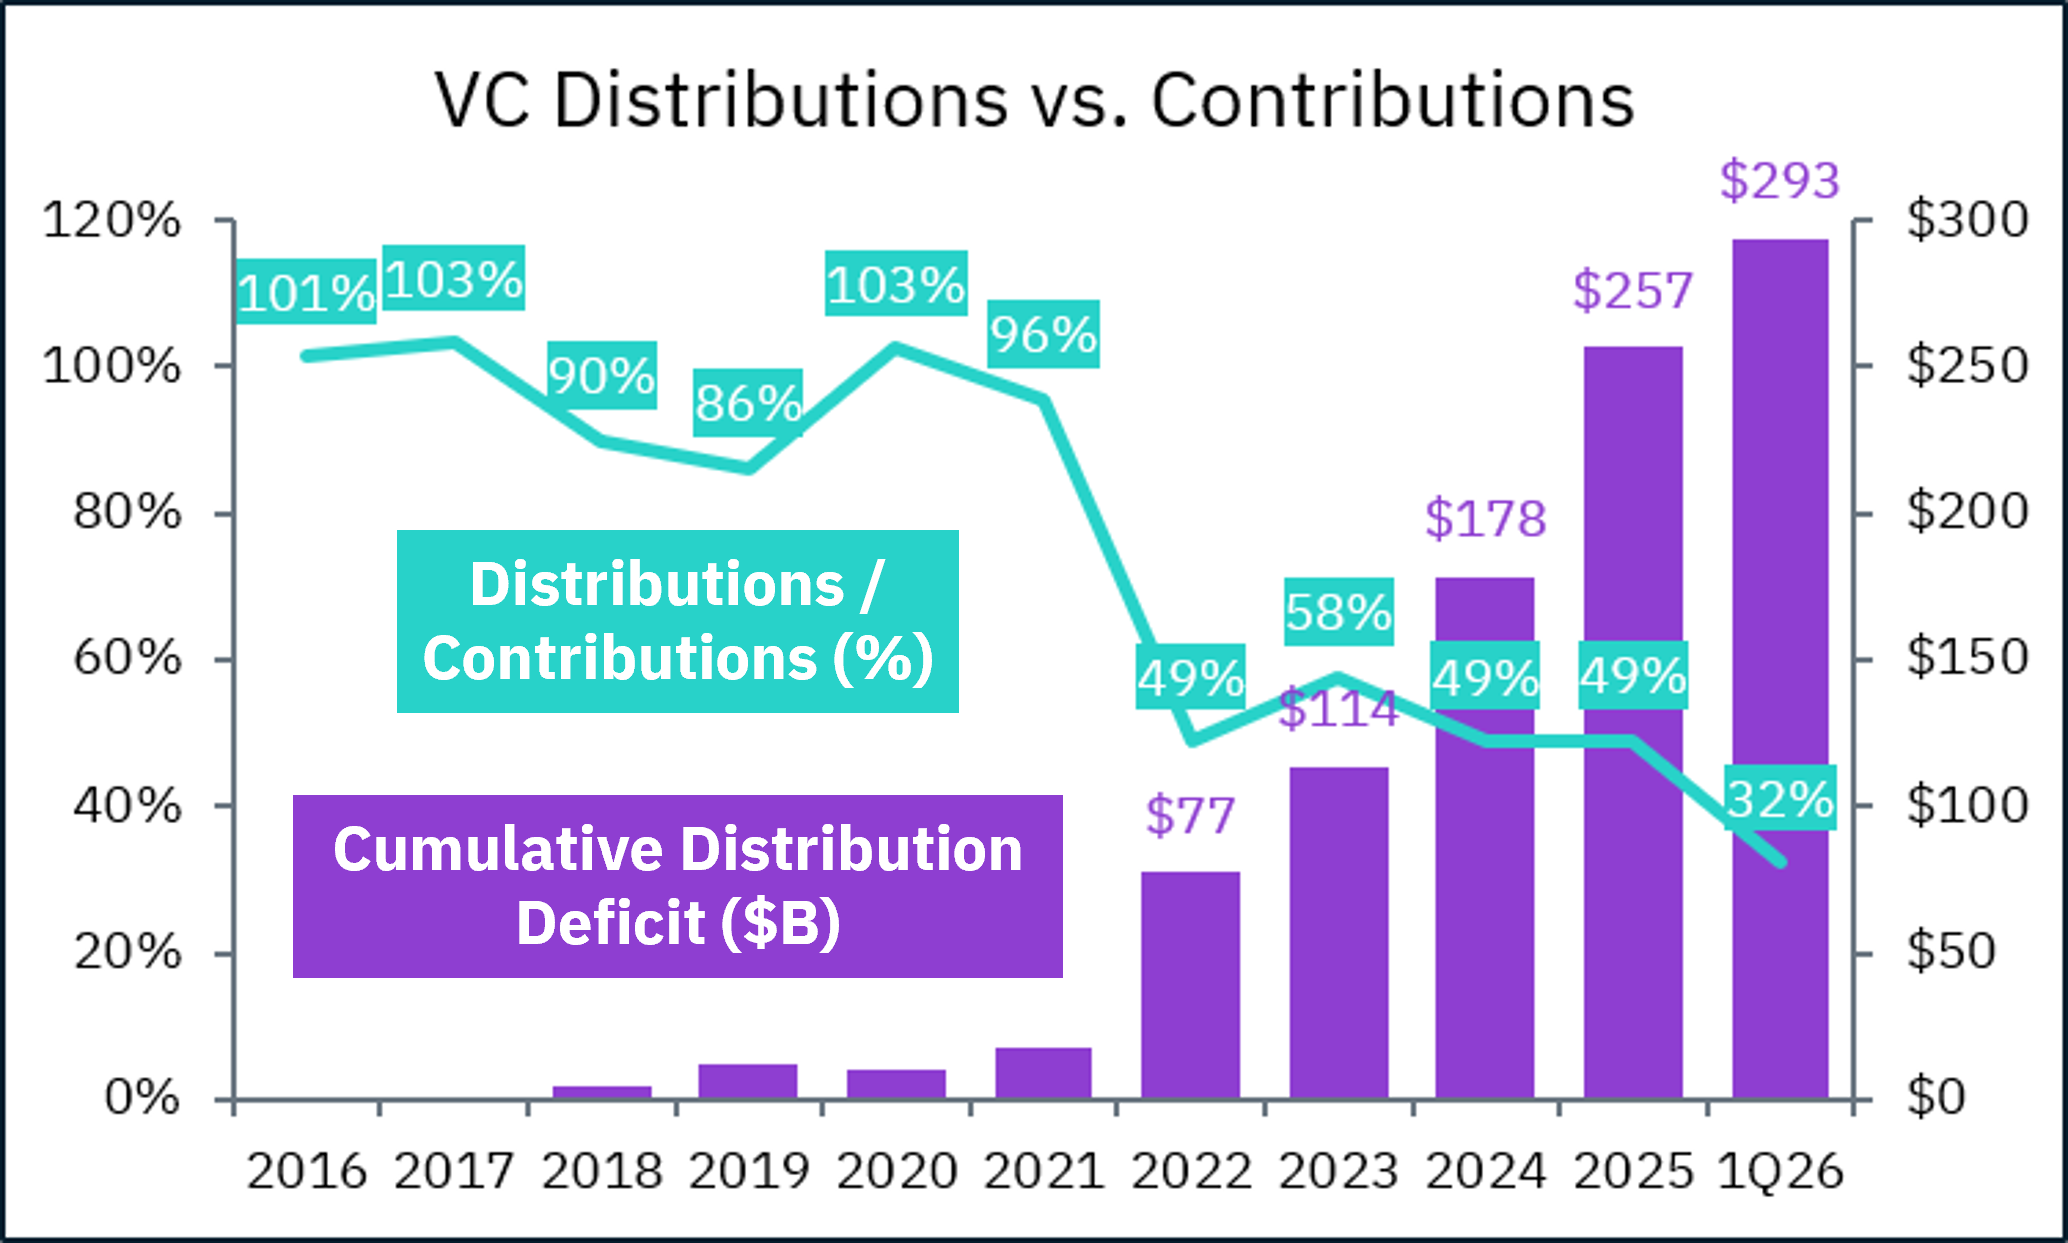
From 2016 to 2021, annual distributions roughly equaled contributions, but since 2022, the ratio has come down. Way down. From 2022 to 2025, distributions have been only about 50% of contributions – 4 consecutive years of older funds returning considerably less than amounts needed for newer, larger funds. And the early data on 2026 is not promising either, with the Q1 ratio down to 32%. The cumulative deficit over the past decade has grown to $293 billion.
Backlogs building, a lack of excitement about the year of liquidity… what’s a VC to do?
How about that “quiet” market we studied a few years ago?
Secondaries are proving to be an important release valve for the VC industry. Once again leaning on quarterly data from PitchBook, we see a rapidly growing US VC secondary market.
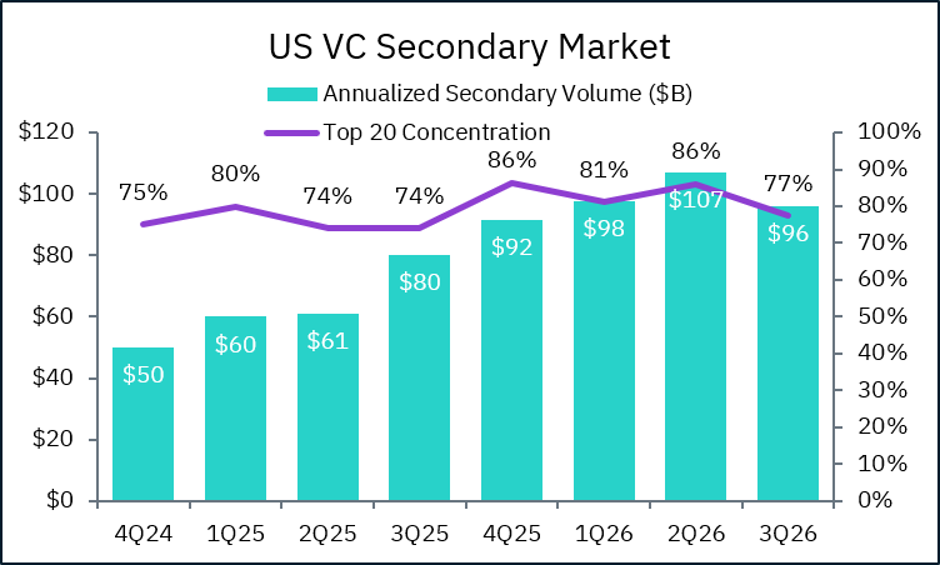
Annualized secondary volume has nearly doubled in under two years, from $50 billion in 4Q24 to $96 billion in 3Q26. One thing to note is the purple line in the graph.
Approximately 80% of VC secondary trading value comes from just 20 companies (think LLMs, prediction markets, Databricks), and that concentration has barely changed over the last two years. The secondary market is growing, but not necessarily broadening.
Perhaps this is all playing into a standard VC strategy – relying on a few big winners to drive returns. But as those winners get bigger and bigger, more VCs may be left on the sidelines.
Still, a $100 billion annualized secondary market is nothing to sneeze at. It may not solve the industry’s liquidity problem, but it does offer something increasingly valuable: a way for investors to exit without waiting for their portfolio companies to do the same.
Maybe the next big VC exit won’t be an exit at all.
