News

News
FTFL - From SOX to SPACs - 30 Years of Tech IPOs
This article appeared in our April 2024 issue of From the Front Lines, Bowen’s roundup of news and trends that educate, inspire and entertain us. Click here to subscribe.
Over 25 years ago we got our start in growth tech as IPO bankers. I mean this is all we did. The great internet bubble led to the creation of over 600 newly minted public tech companies over a 6 year period, including over 300 in just 1999 and 2000. How does that compare to today?
This month we analyzed tech IPOs on Nasdaq & NYSE over the last 30 years. A lot has changed in three decades.
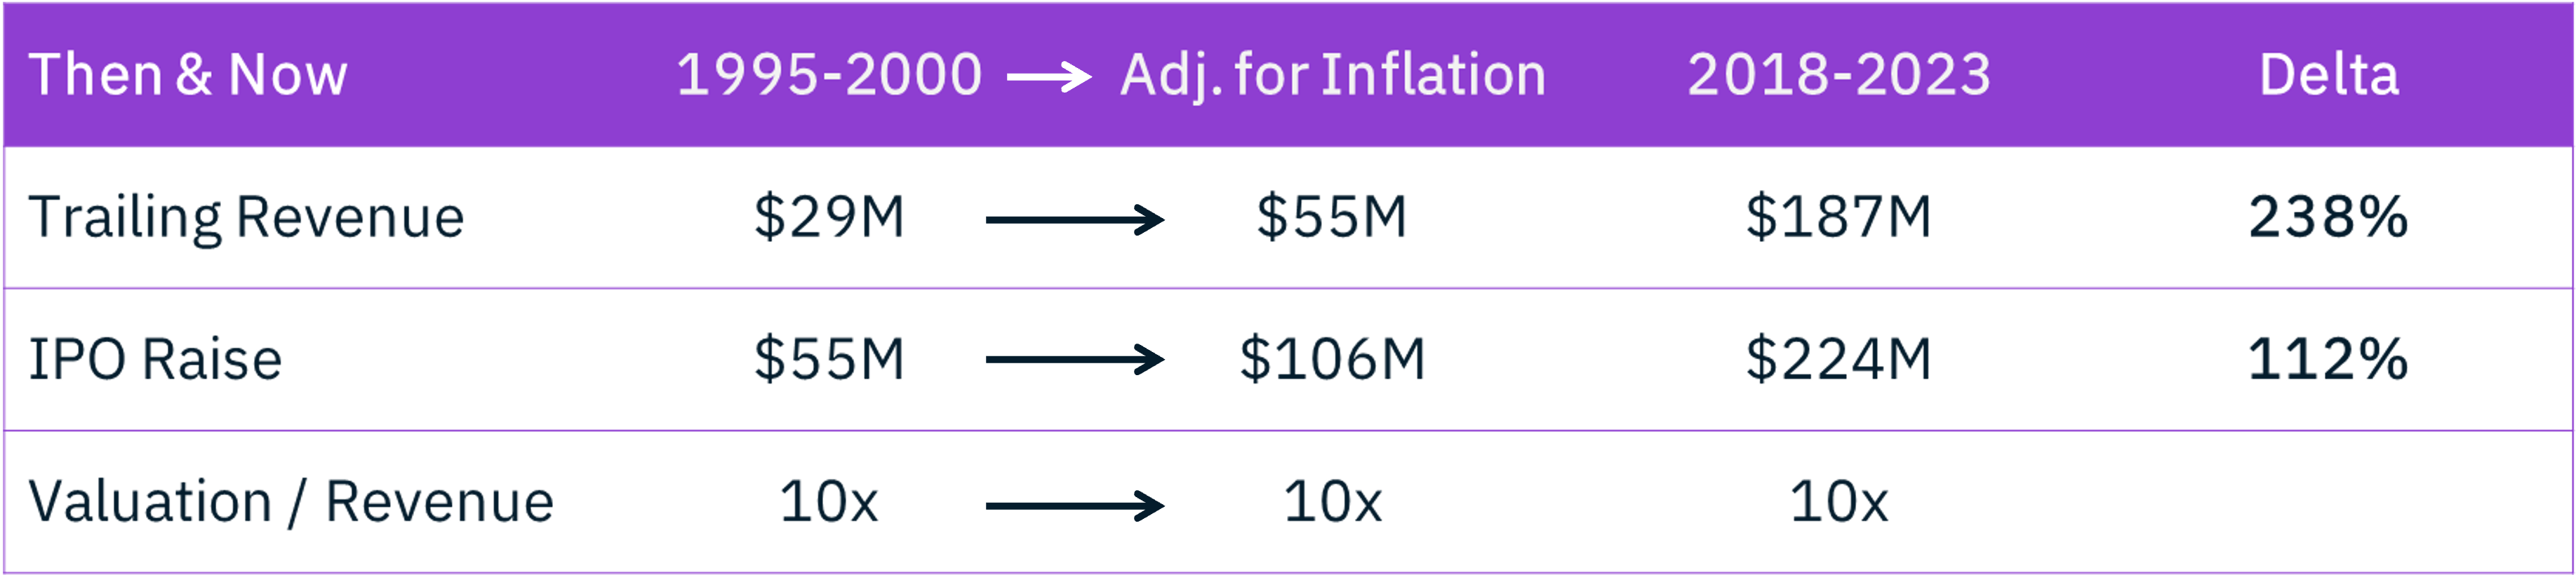
The median tech IPO now involves a company with $187M in revenue (up 238% vs. 1995-2000, adjusted to today’s dollars) raising $224M (up 112%). Interestingly, the median revenue multiple has not changed, remaining at 10x for both time periods.
We believe the increase in revenue mass and deal size has been driven by two factors.
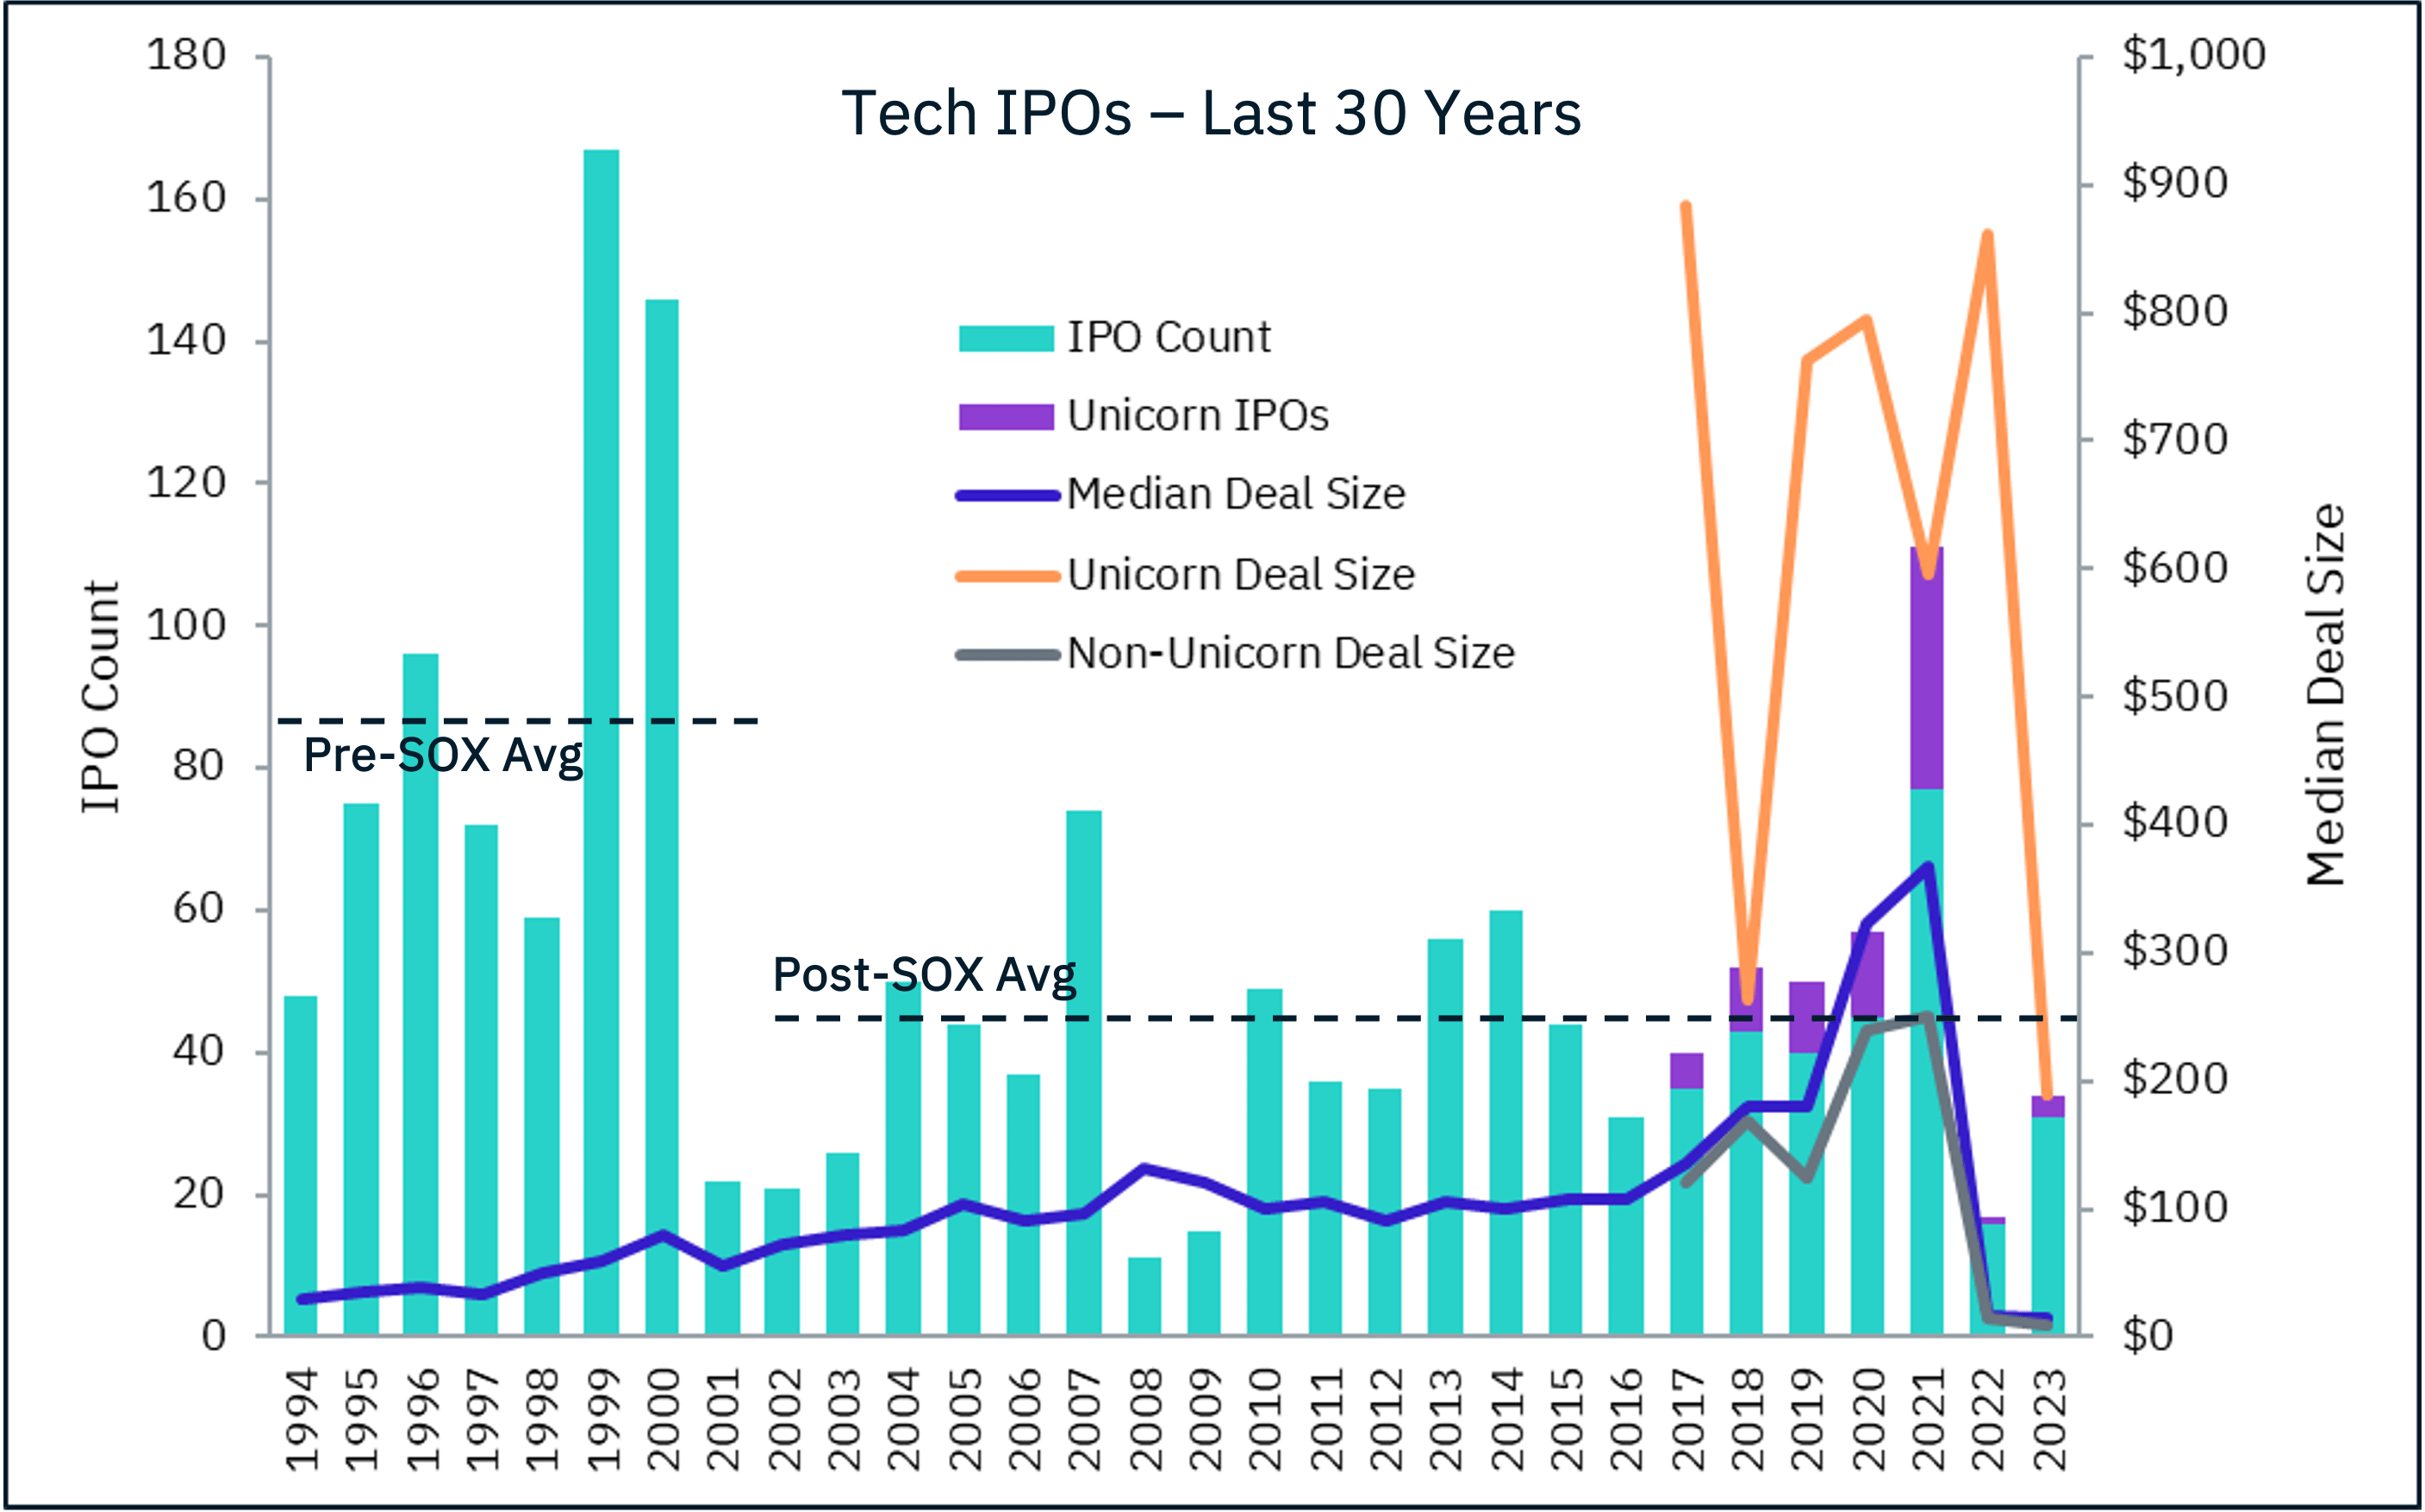
First: Unicorns. Big private companies need big exits. From 2017 to 2021, 70 unicorns went public, representing 23% of all tech IPOs, peaking with 34 in 2021. Median deal size for unicorn IPOs during this period was over $650M, nearly 5 times larger than non-unicorn IPOs. But then, just like that, the window slammed shut, with only 1 unicorn IPO in 2022 and 3 in 2023.
The other driving factor has been the Sarbanes-Oxley Act, passed in 2002 in the wake of the Enron and Worldcom scandals. The additional costs ($1M+ annually) and time burdens (~50% of internal audit functions) of SOX compliance have raised the bar on the minimum size company it takes to absorb these requirements.
The long-term effect of SOX has been clear: pre-SOX there were 86 tech IPOs per year. Post-SOX that number has been cut in half to 43 per year.
But as we’ve learned over the last 5 years, IPOs aren’t the only way for a tech company to go public. Never fear, SPACs are (still) here. Many of those blank-check companies that were formed during the 2020-2021 SPAC bubble are still out there and closing de-SPAC transactions, creating new public tech companies.
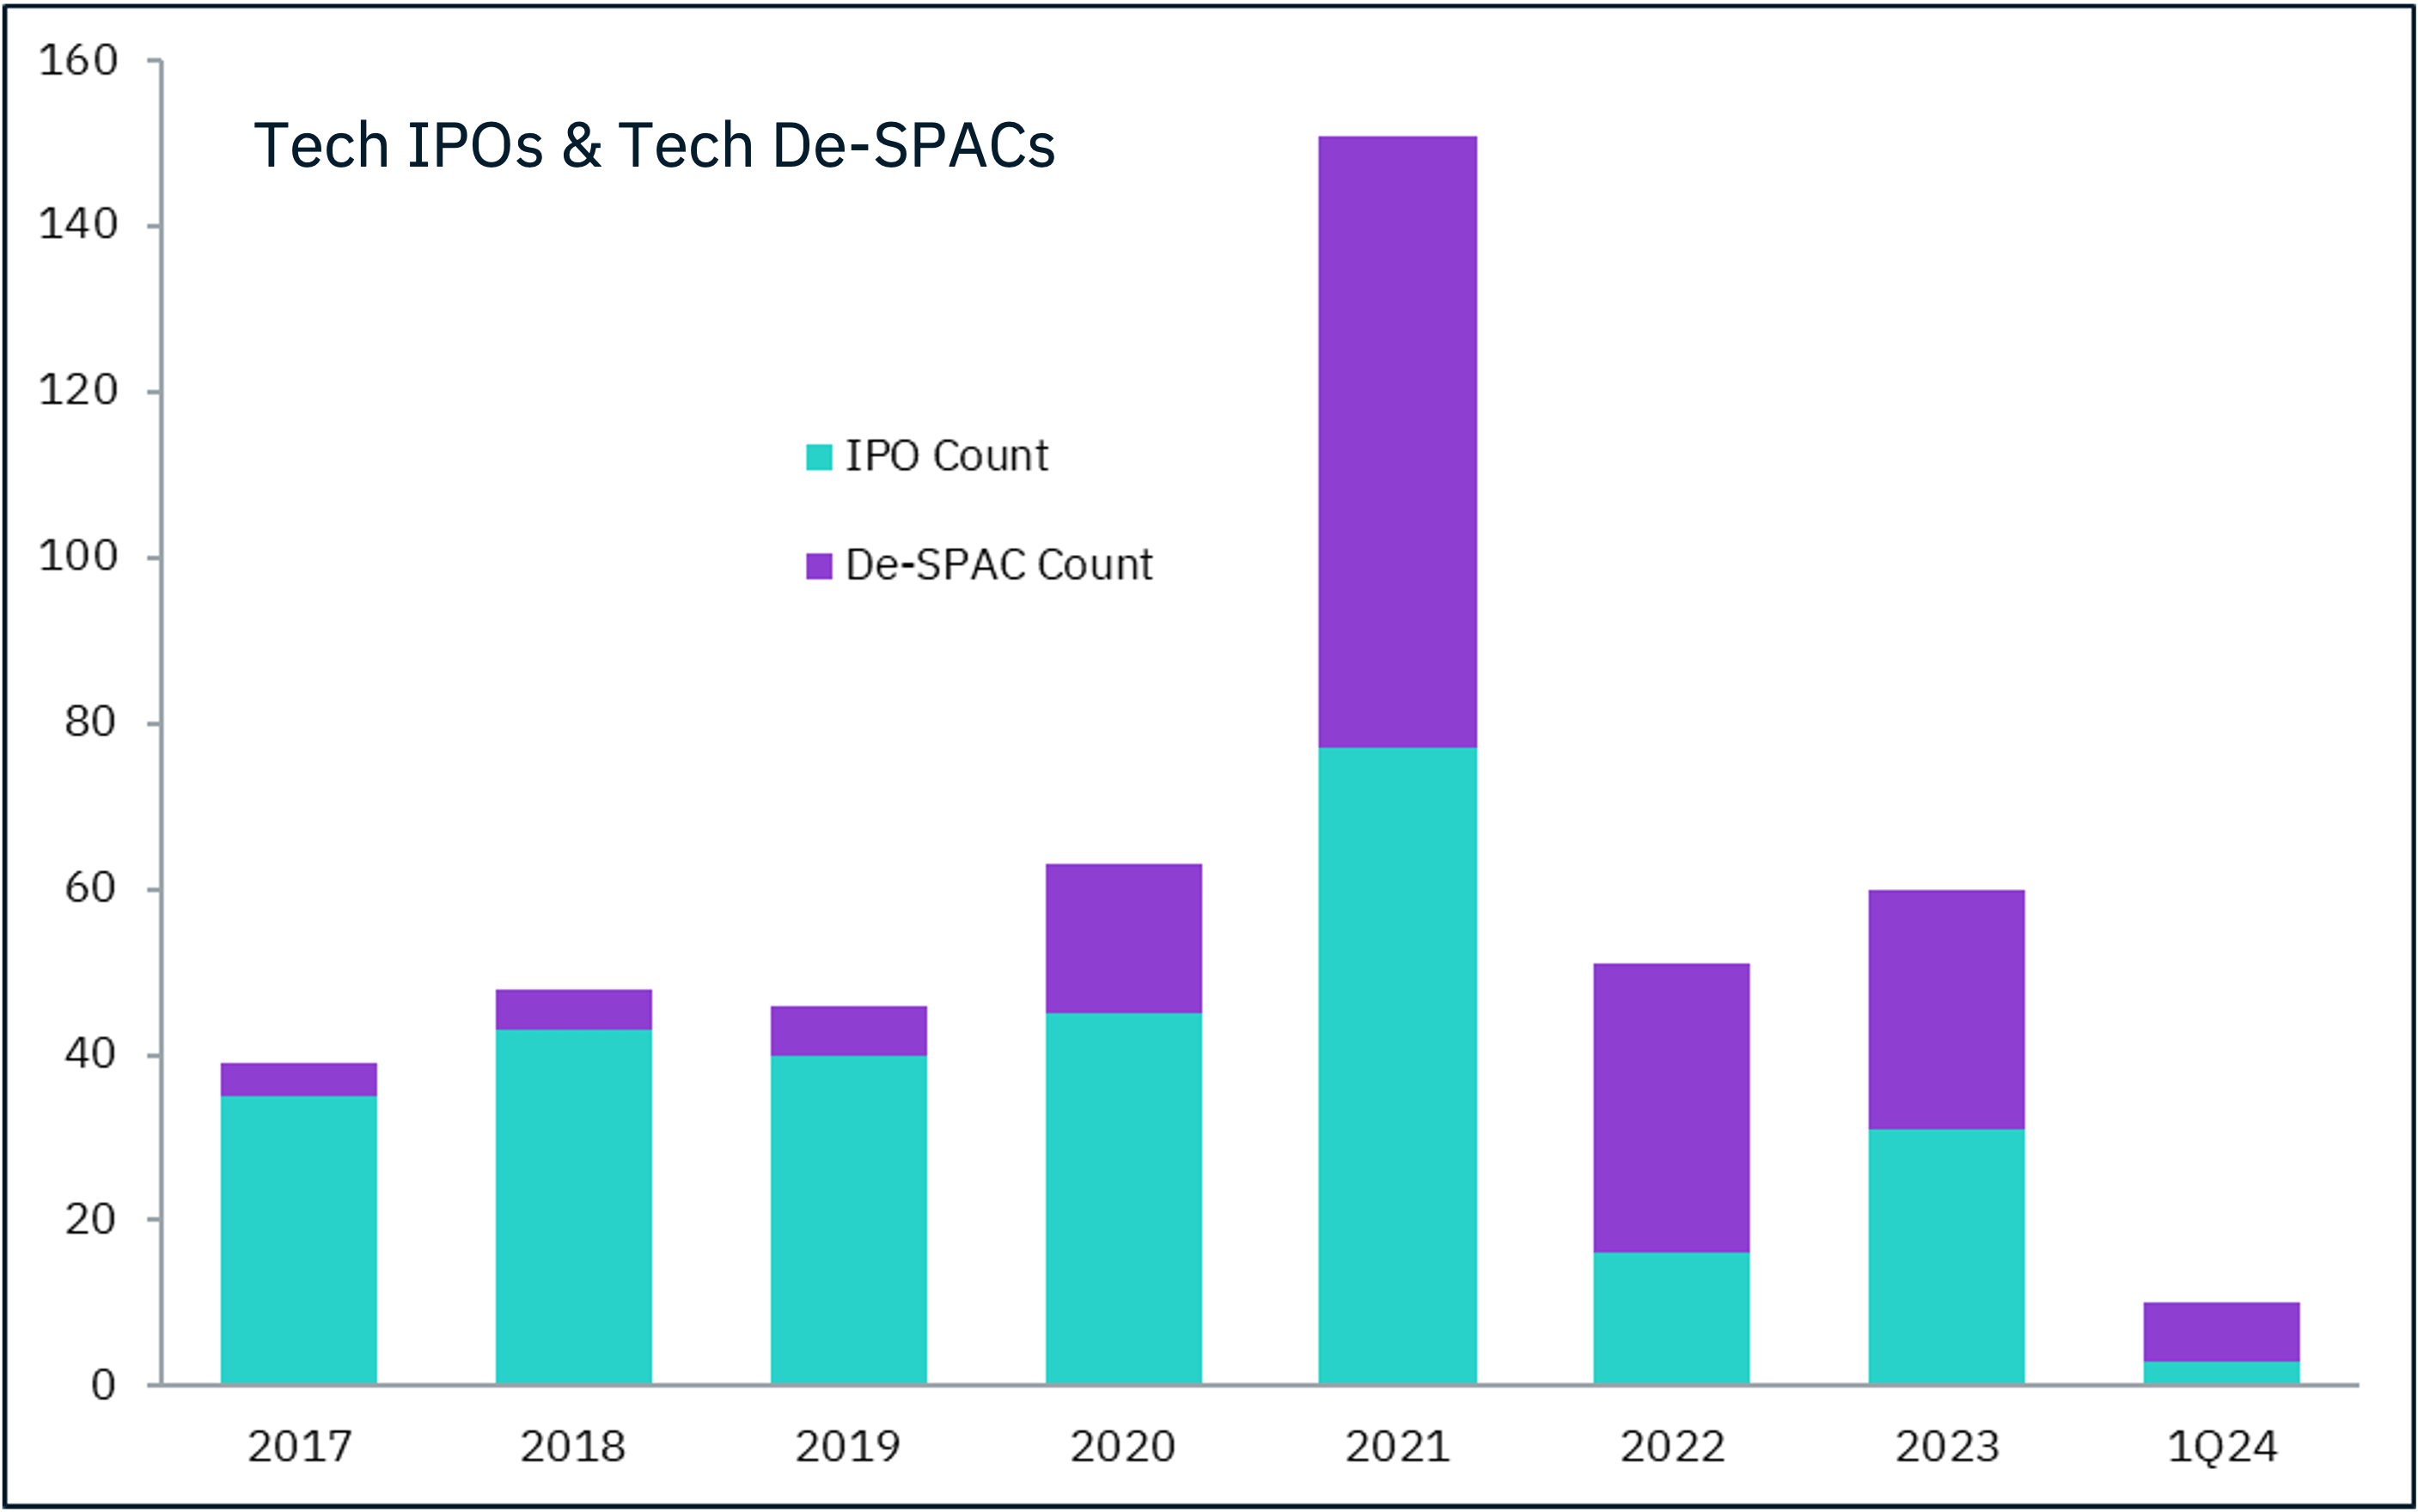
Layering in tech de-SPACs presents a whole new story. Since SPACs took off in 2020, IPOs + de-SPACs have averaged 94 per year, 9% higher than the pre-SOX era.
However, not all public companies are created equal. While recent tech IPOs have been completed by $187M revenue companies (as we noted earlier), de-SPACs have been done by less mature companies, at median trailing revenue of $58M, very close to the inflation-adjusted $55M from the pre-SOX era. 20% of tech de-SPACs have been with companies with under $10M in trailing revenue. The SEC recently adopted new rules for SPACs to protect investors, so we might see a SOX-like effect on de-SPAC volume.
Between the pace of tech IPOs cut in half, the 30-year downward trend in the number of publicly traded companies, and the concentration of the Magnificent 7’s market power, the liquidity outlook for tech companies today is much different than it was three decades ago. For the current generation of young and extremely talented entrepreneurs, a public listing is barely even an aspiration. However, as growth tech ambassadors and M&A specialists, Bowen remains steadfast that a healthy public company ecosystem with deep liquidity is what sets US markets apart.