
News
News
FTFL - Return of the SPAC
Three years ago, we did a look-back at the SPAC bubble of 2021. Our thinking at the time was “what can we learn about this ancient financial relic?”
Well, like baggy jeans and vinyl records, SPACs are back. And now is a good time to do another look-back to see if we actually learned anything, and what might be different about this new batch of SPACs and de-SPACs.
Let’s start with the count.
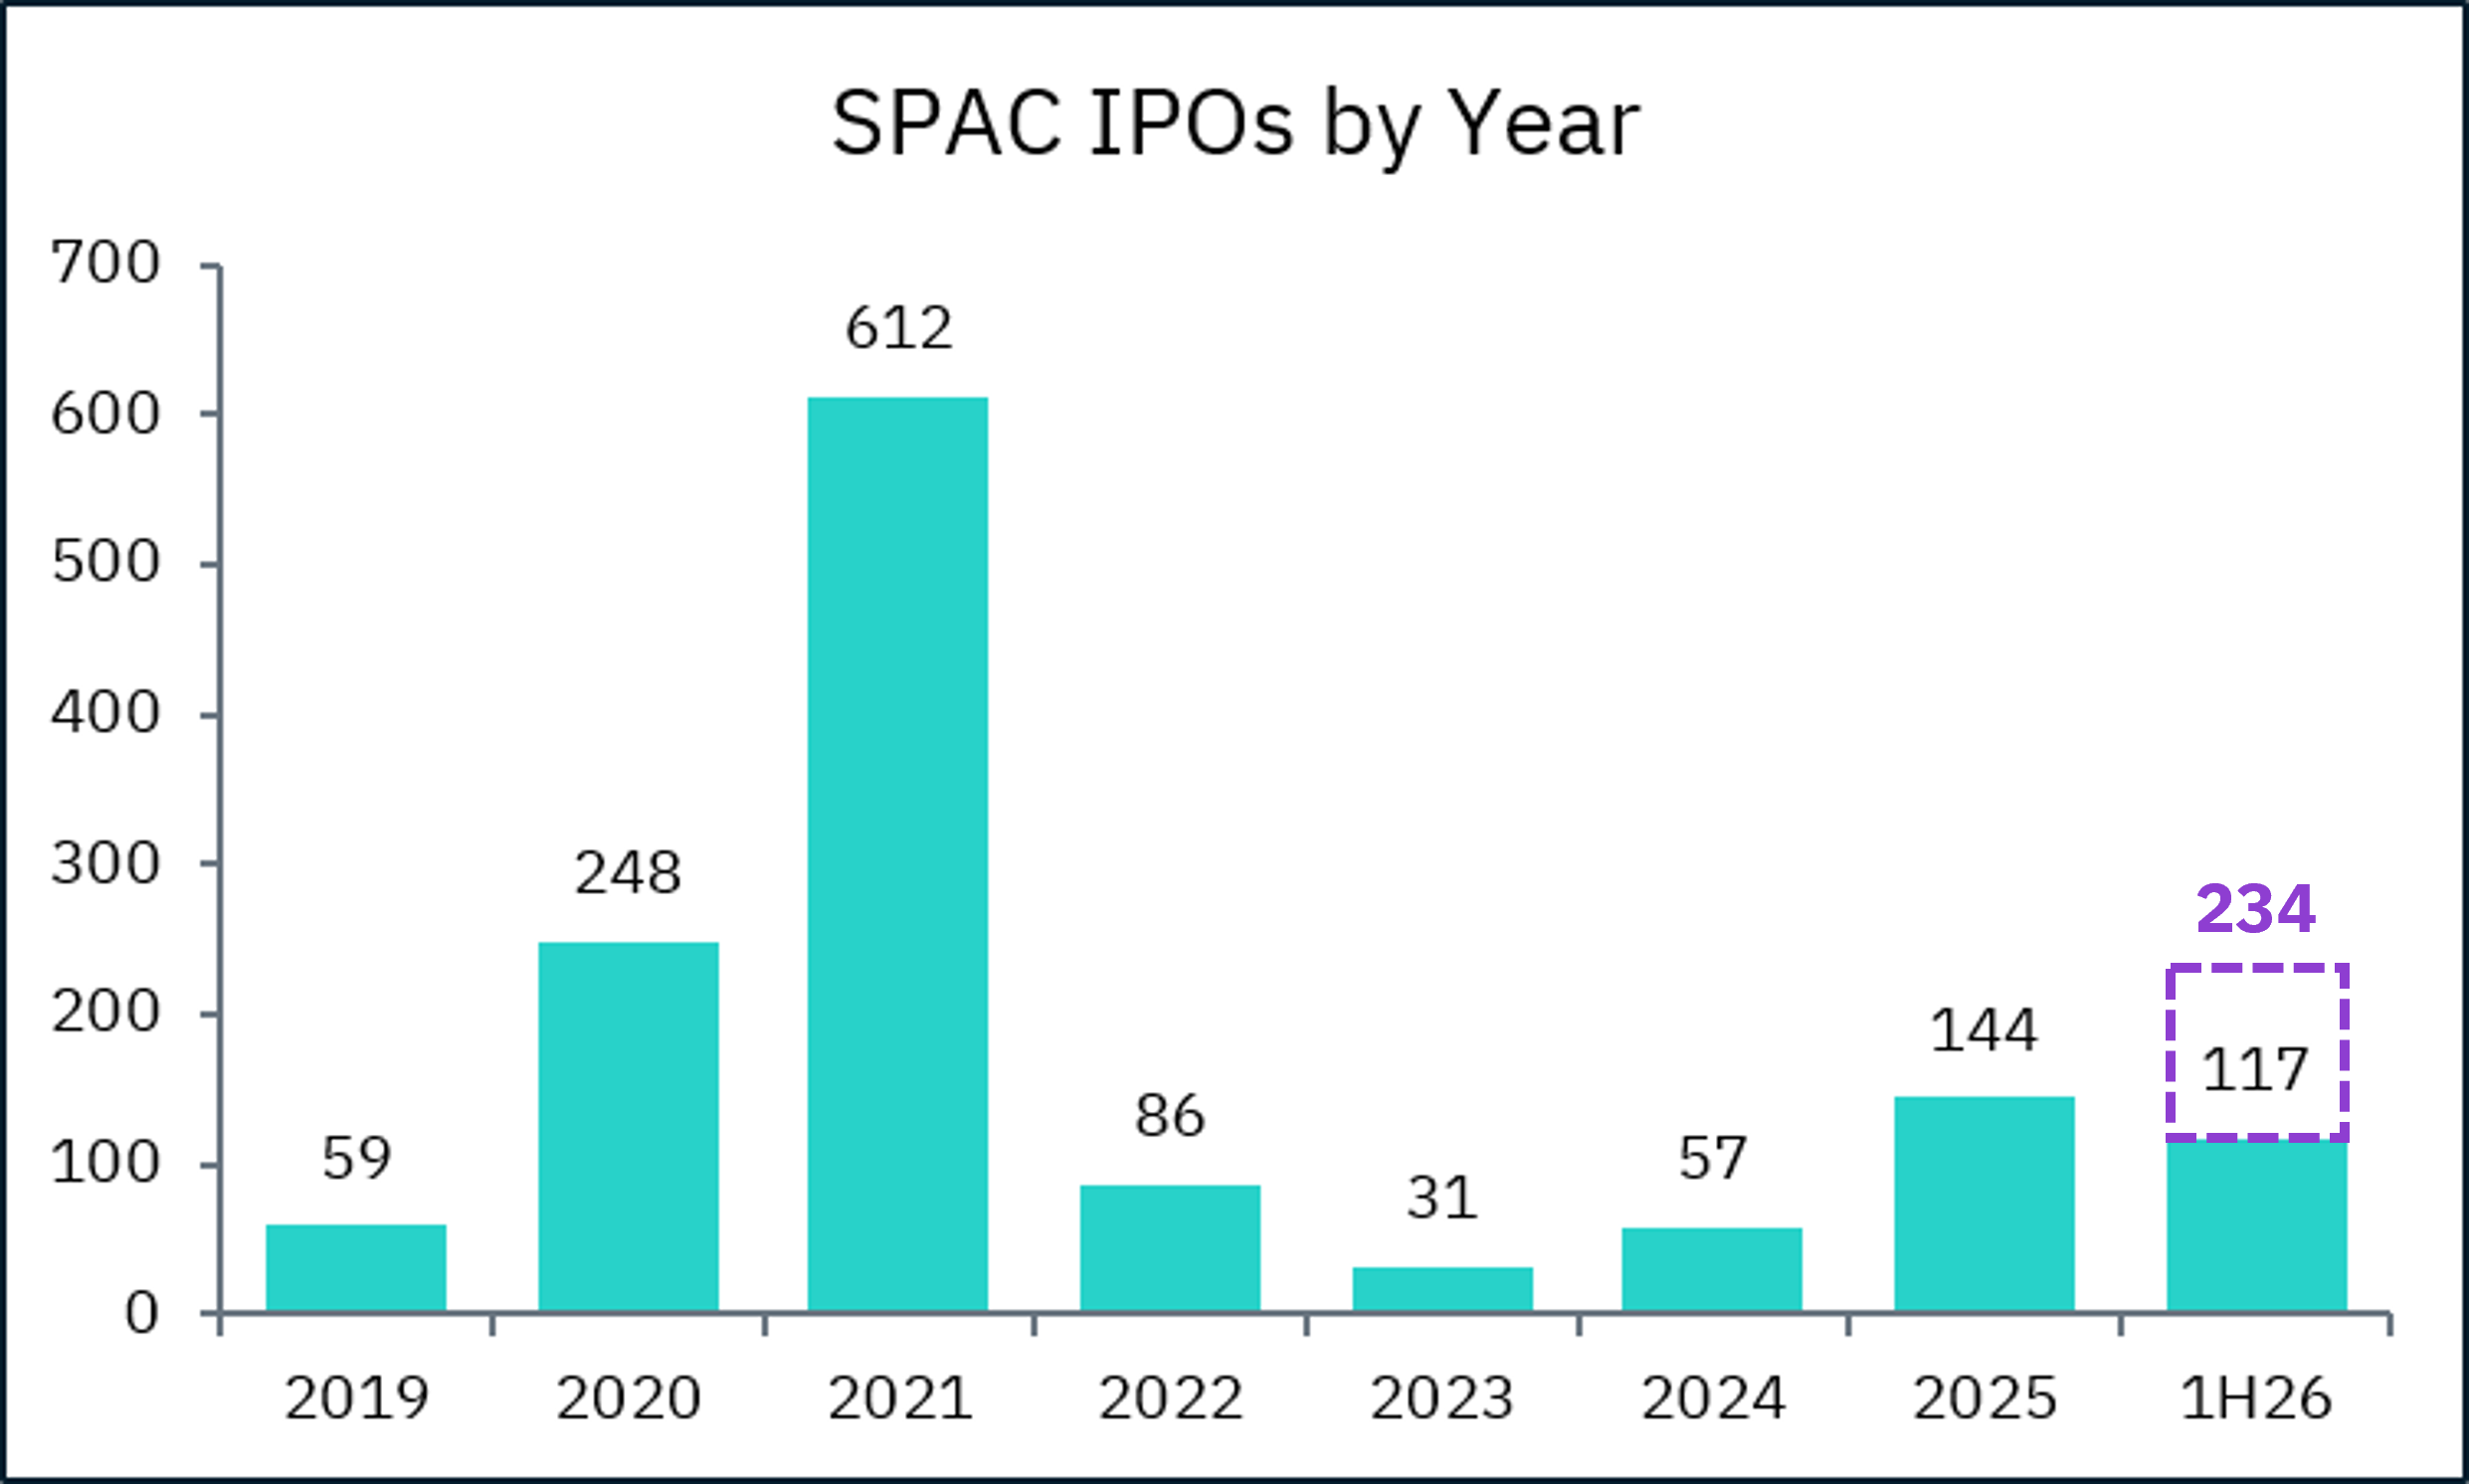
SPAC IPOs have grown considerably since the 2023 low, on pace this year for a 96% CAGR. While that is impressive growth, what stands out in this chart is how 2026 will still be nowhere near the peak of 2021 – truly a bubble year.
Next, we broke down each SPAC IPO year by current status – still searching for target, announced a de-SPAC, completed a de-SPAC, or never found a target and eventually liquidated.
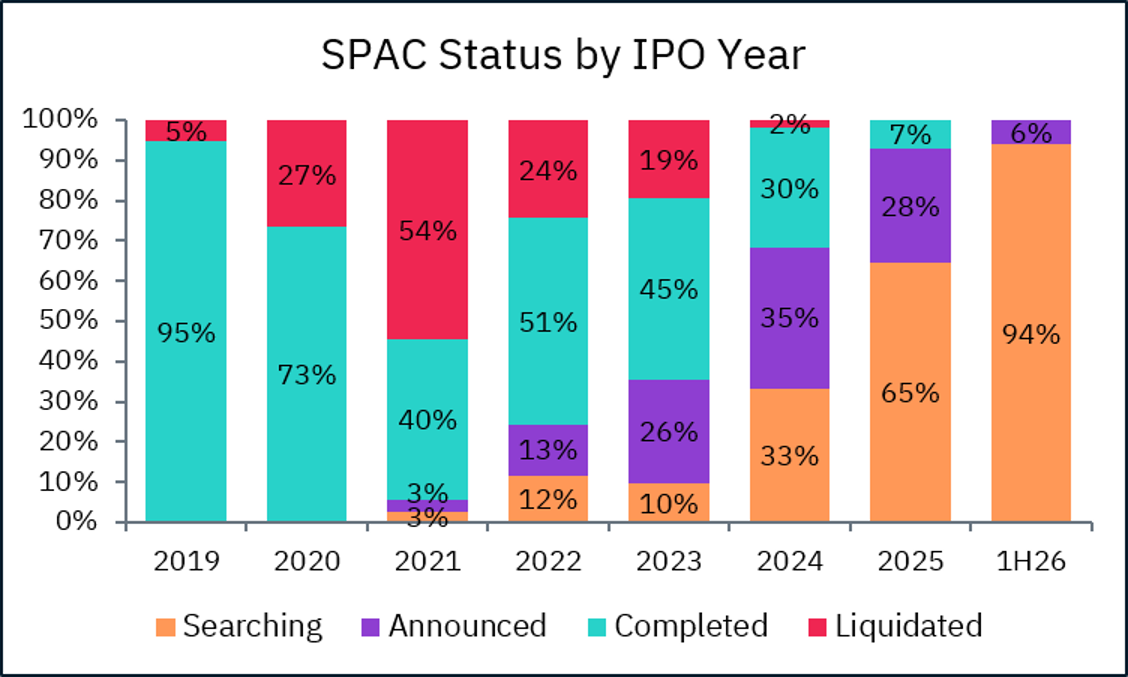
Another bubbly data point: unlike any other year, more than half of 2021 SPAC IPOs could not find targets and had to send their IPO funds back to shareholders. That supply-demand imbalance has clearly corrected since then, but we should keep an eye on that liquidation rate should SPAC IPOs continue to grow at their current pace.
Drilling down into the “completed” group, we took a look at how they have traded since merging with a target – has there been any improvement since the 2021 bubble? We grouped de-SPACs by trading range (or exit price where applicable). Remember, the base price for all SPACs is $10.00 per share.
- Dead – out of business or trading at $0.00 to $0.09 per share
- In danger – $0.10 to $0.99 per share
- Suffering – $1.00 to $4.99 per share
- Close to par – $5.00 to $9.99 per share
- Thriving – $10.00+ per share
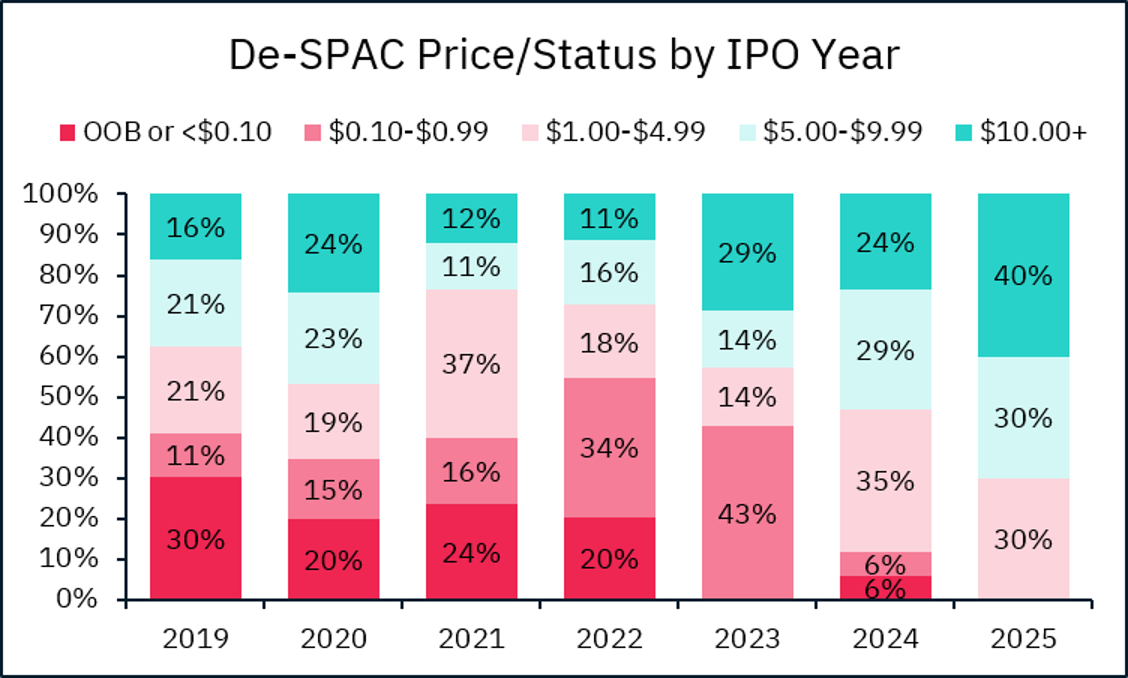
Here we see the 2021 and 2022 cohorts performing the worst, with 77% and 73%, respectively, trading below $5.00 per share. Meanwhile, it’s early for the 2025 group, with only 10 completed de-SPACs so far, but the initial results are promising, with 4 of the 10 trading above $10.00 per share.
Moving onto industry sectors, we did a “then & now” analysis on the companies that have been merging with SPACs, comparing the class of the 2021 to the 2025-26 completed and announced group.
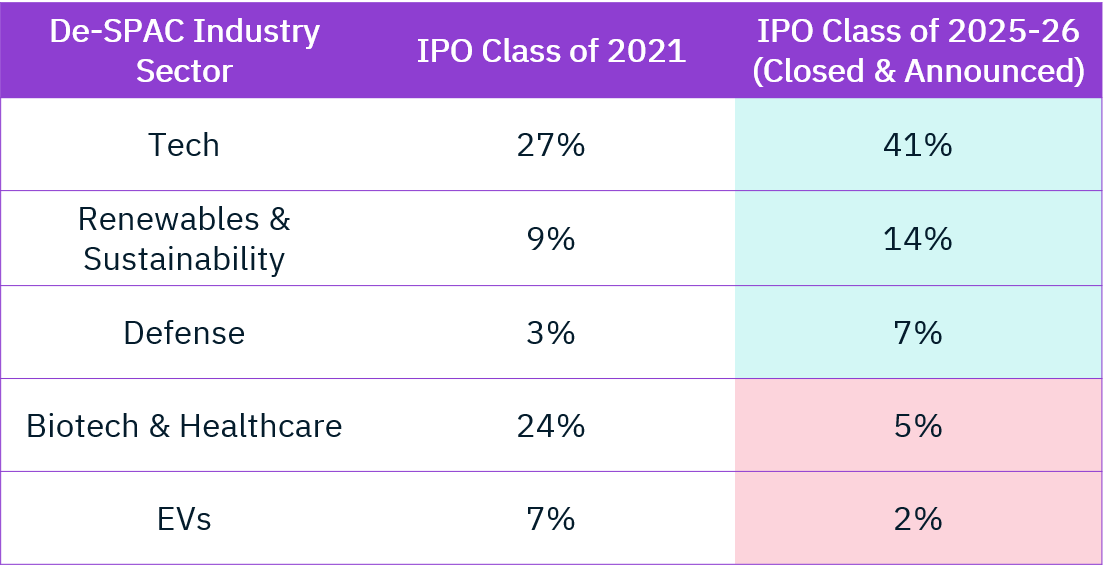
Tech has become a much hotter de-SPAC sector vs. 5 years ago, while biotech & healthcare have fallen out of favor. Defense, as well as renewable & sustainability companies have also become more popular as SPAC targets, while EV de-SPACs have nearly disappeared.
Finally, we profiled a few of the de-SPACs from over the years – first, some of the winners, trading well above $10.00.
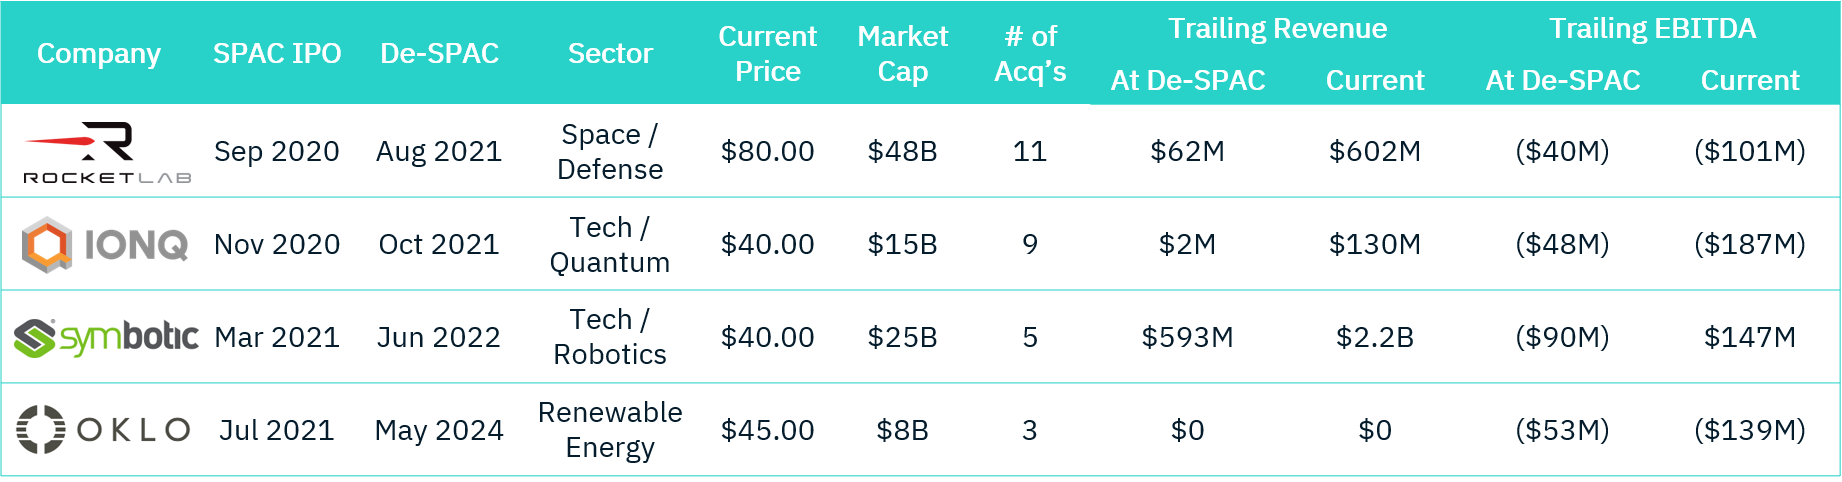
Note the variety of financial profiles – ranging from a pre-revenue company remaining pre-revenue two years later to a scaled, IPO-ready company growing by nearly 4x and achieving solid profitability. Clearly there is no “blueprint” for a successful de-SPAC.
Next we looked at a few of the Class of 2025 de-SPACs.
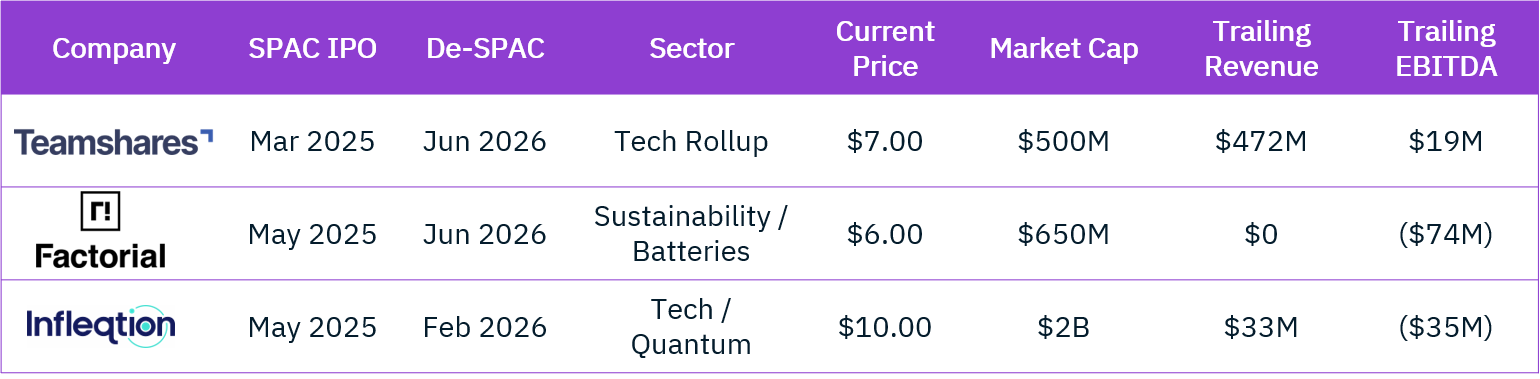
No home runs yet in the most recent cohort, but again a wide spectrum of profiles in revenue scale and profitability.
So, did we learn anything? Enough to say this isn’t 2021 again. The excesses are gone, and post-merger trading appears to be improving. At Bowen, we are seeing SPACs increasingly becoming liquidity and funding partners for scaled roll-ups, including in areas like quantum and defense. While the “early stage venture, but public” de-SPAC profiles that were so prevalent during the SPAC bubble still exist today, we see another factor at play that’s likely causing increased discipline. As we pointed out in 2023, SPACs in 2021 were a low-risk cash management alternative to 0.25% interest rates, whereas 3.75% rates today (15x higher) change the calculus. Rates went up. Has the bar?
