News
News
FTFL - The 65%
This article appeared in our January 2023 issue of From the Front Lines, Bowen’s roundup of news and trends that educate, inspire and entertain us. Click here to subscribe.
Bubbles. Widely critiqued, often ephemeral and nearly impossible to time. With the benefit of hindsight, we think it is safe to say that 2021 was the Peak of the Unicorn Bubble, with a spike in $500M+ megafunding rounds at $1B+ valuations.
This got us thinking about other historical capital markets peaks – think these are correlated?
- Peak number of US-listed companies occurred in 1996 with 8,090
- Peak domestic IPOs occurred in 1996, with 677 IPOs raising $62M on average
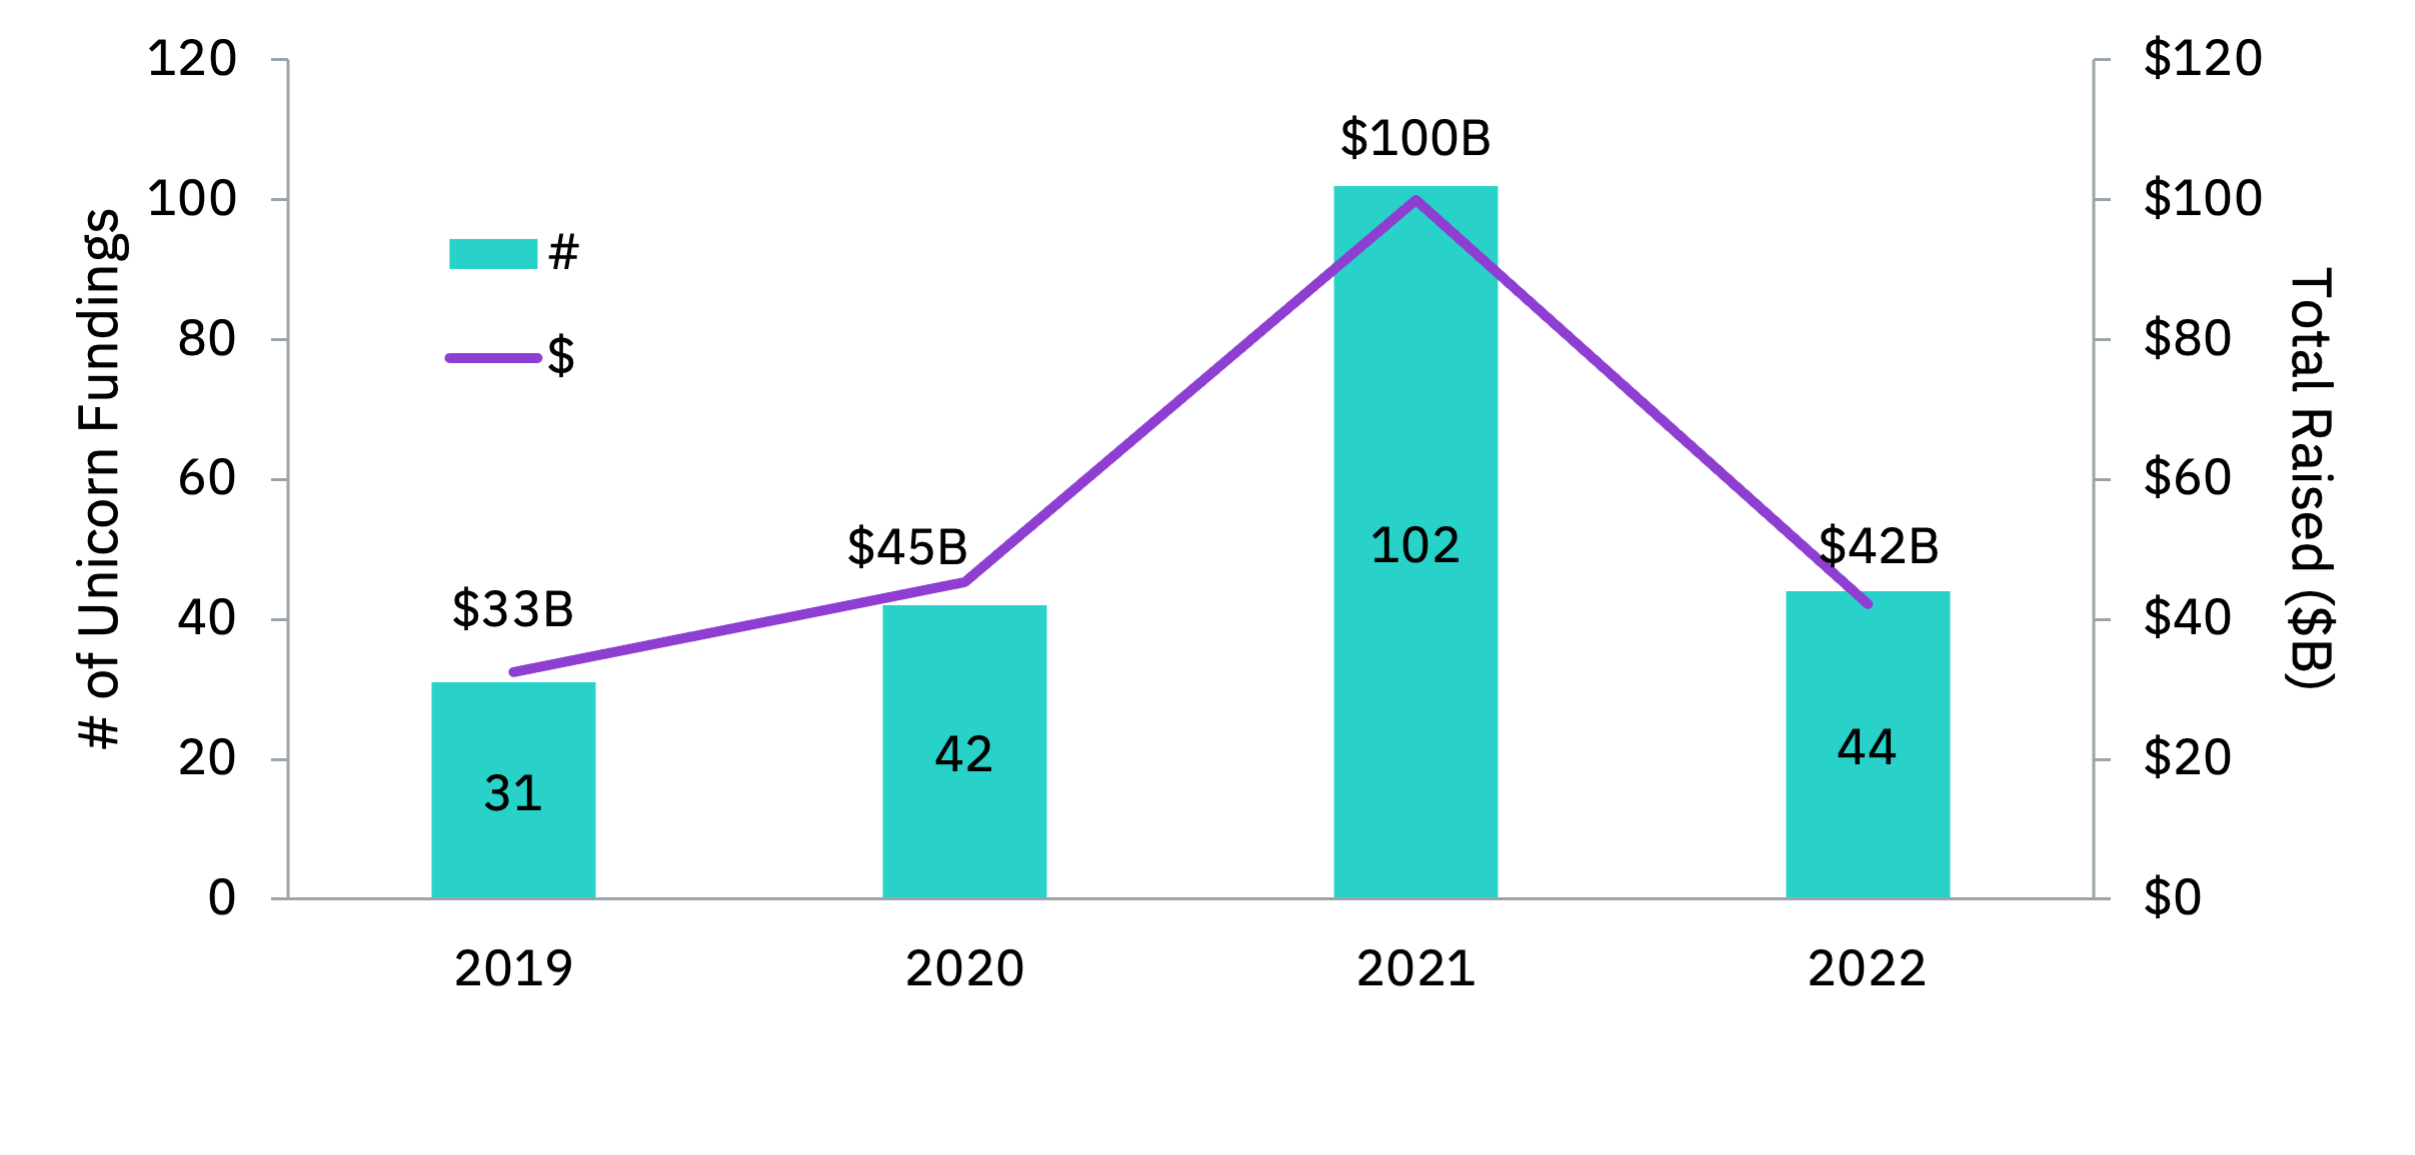
- Per the graph above, peak Unicorn capital raising activities occurred in 2021 with 110 Unicorns raising $925M on average
- Peak Unicorn average capital raised was ~15x Peak IPO average capital raised (adjusted for inflation that works out to ~8x greater)
Well of course IPO volume is at a 30-year low when so much capital has been doled out in the private capital markets!
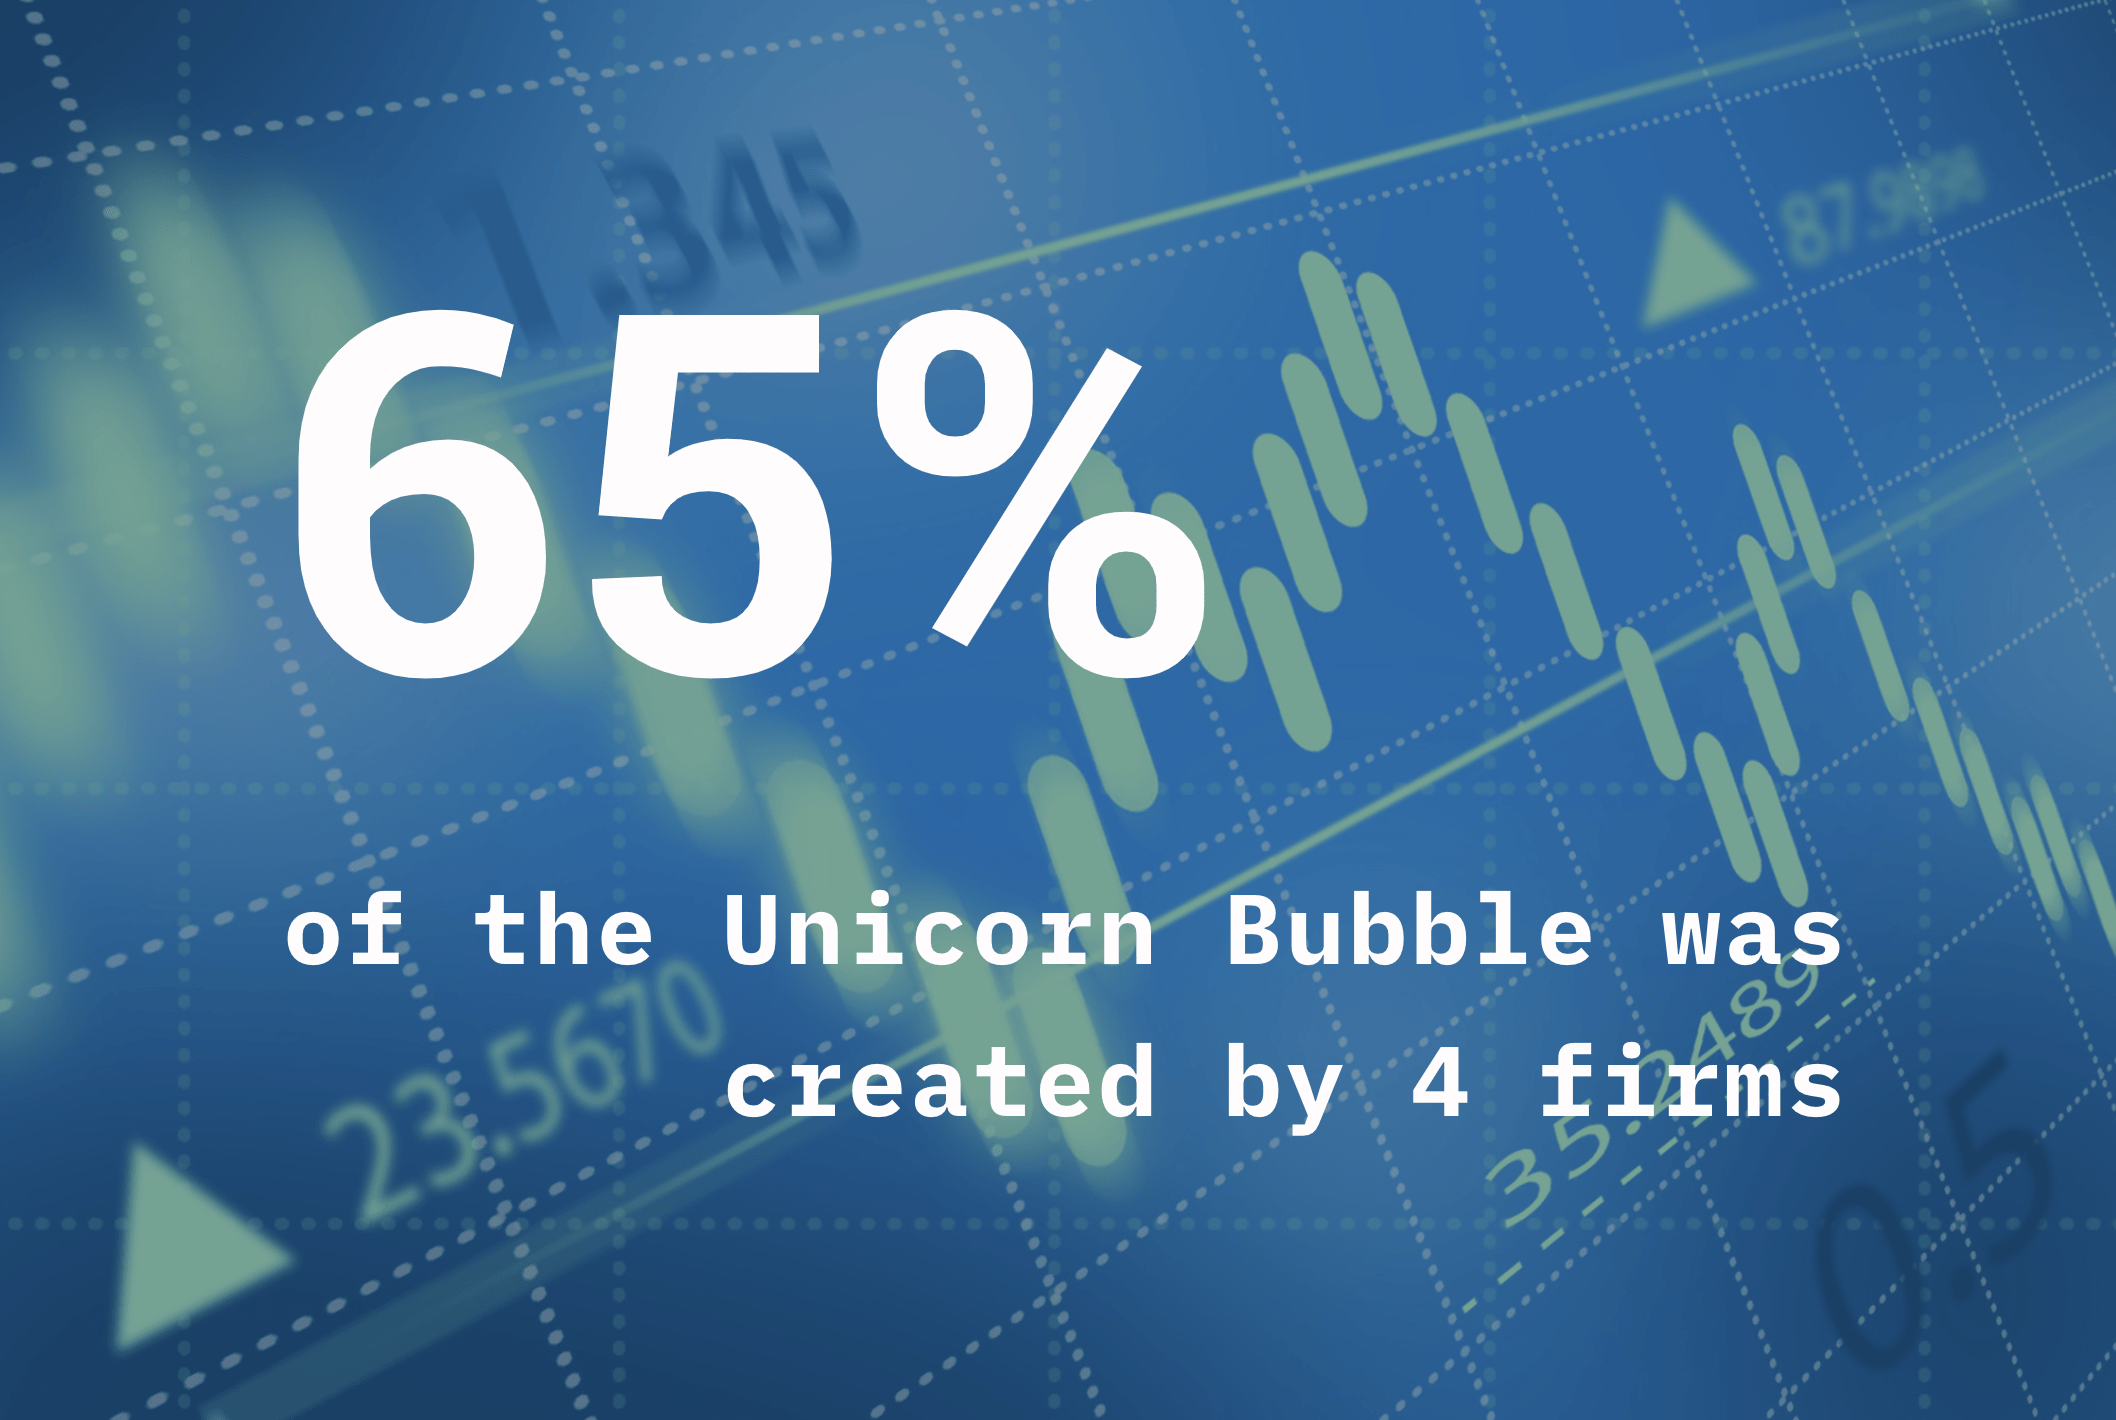
Now, what if we told you that fully 65% of this Unicorn Bubble was created by FOUR firms – out of 2,889 US VCs. At their 2021 peak, each of these firms was participating in $925M rounds every other week. If that is hard to put into perspective, that is because there is no perspective! And that is why we call it a Bubble.
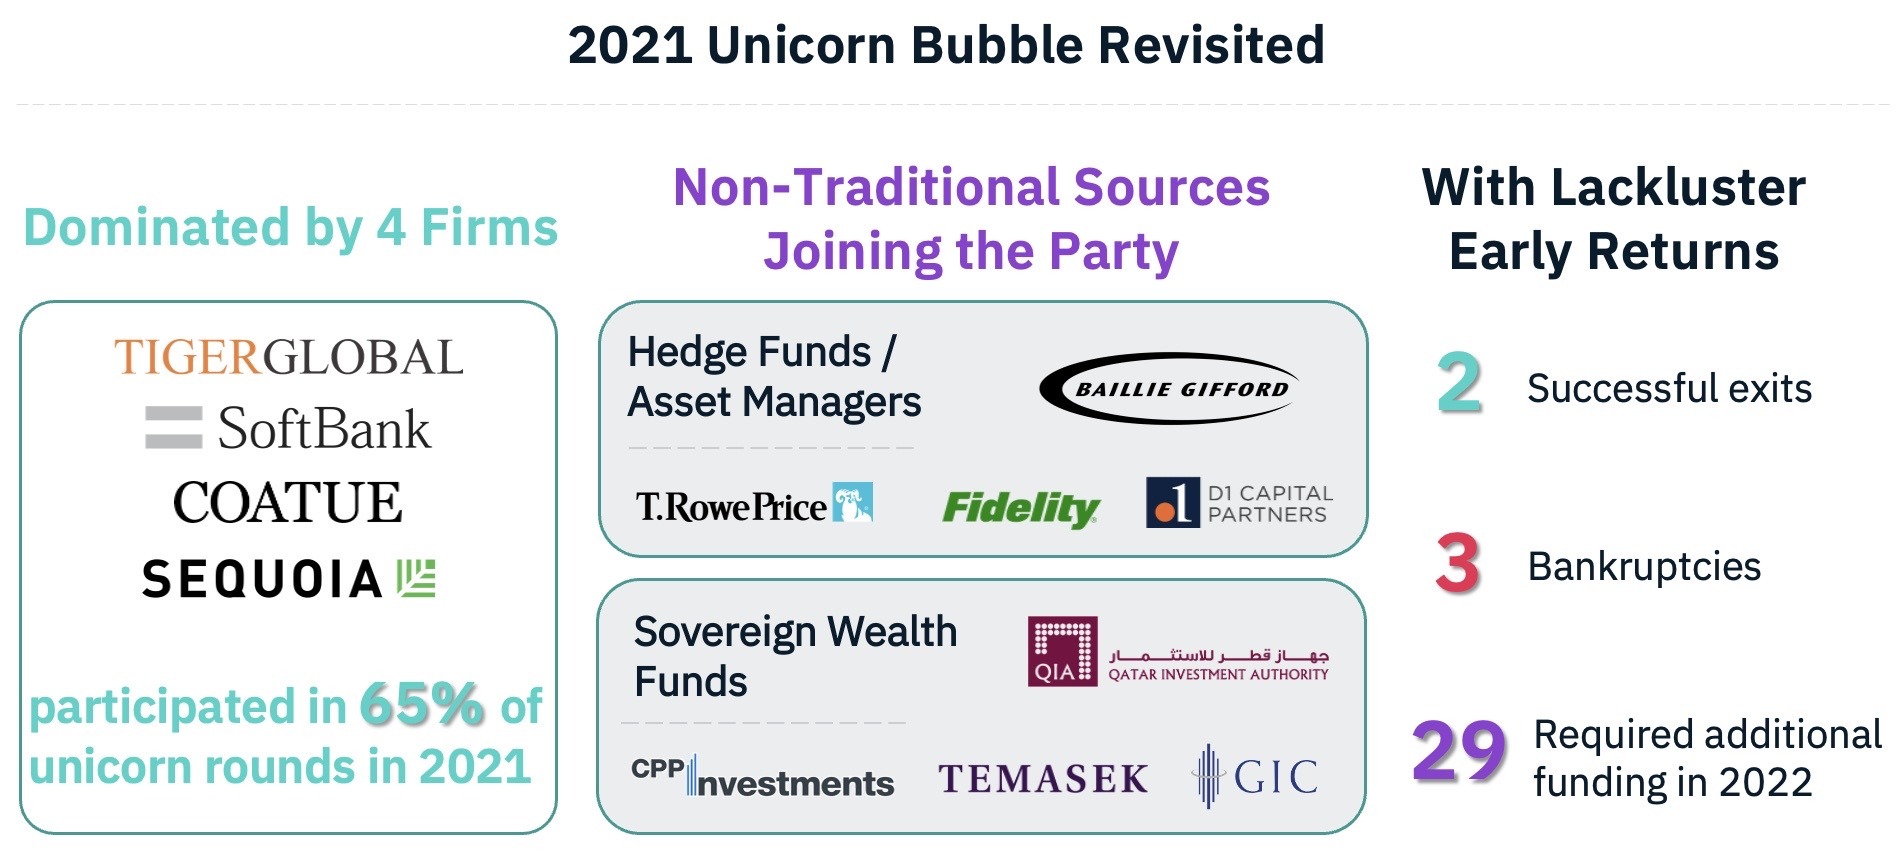
As Growth Tech ambassadors, we can not recall a time when the private capital markets have been so cornered with 15% of total invested capital captured by just 0.3% of all venture investments.
Here’s to more equality, or less inequality, in 2023!